

Effects of temperature on mortality in Chiang Mai city, Thailand: a time series study
- PMID: 22613086
- PMCID: PMC3391976
- DOI: 10.1186/1476-069X-11-36
Effects of temperature on mortality in Chiang Mai city, Thailand: a time series study
Abstract
Background: The association between temperature and mortality has been examined mainly in North America and Europe. However, less evidence is available in developing countries, especially in Thailand. In this study, we examined the relationship between temperature and mortality in Chiang Mai city, Thailand, during 1999-2008.
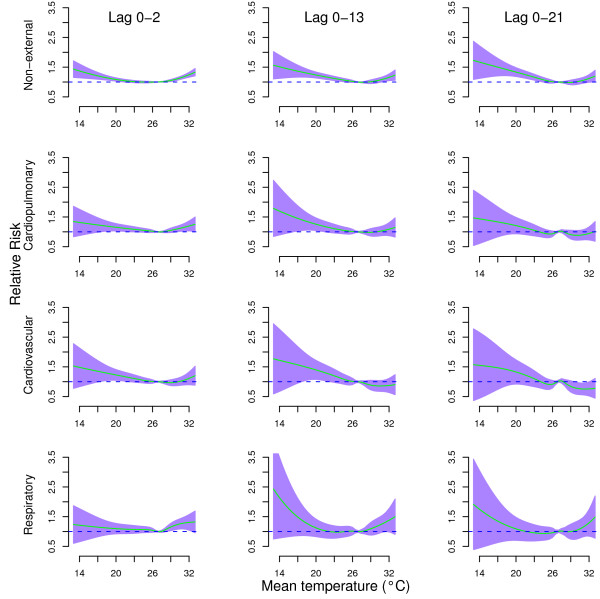
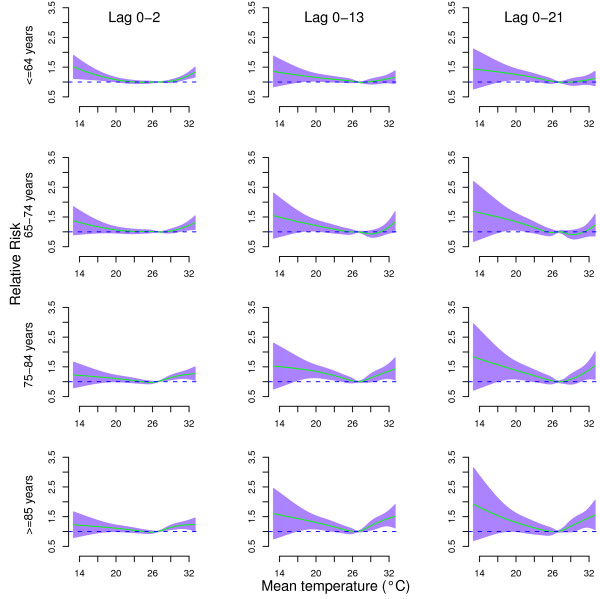
Method: A time series model was used to examine the effects of temperature on cause-specific mortality (non-external, cardiopulmonary, cardiovascular, and respiratory) and age-specific non-external mortality (<=64, 65-74, 75-84, and > =85 years), while controlling for relative humidity, air pollution, day of the week, season and long-term trend. We used a distributed lag non-linear model to examine the delayed effects of temperature on mortality up to 21 days.
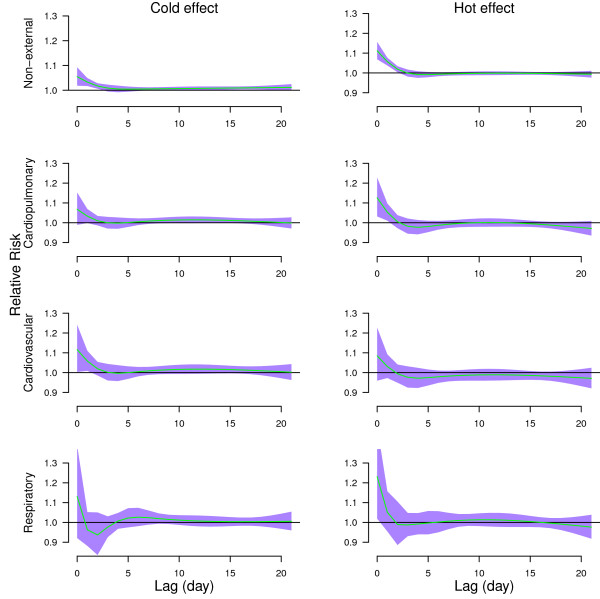
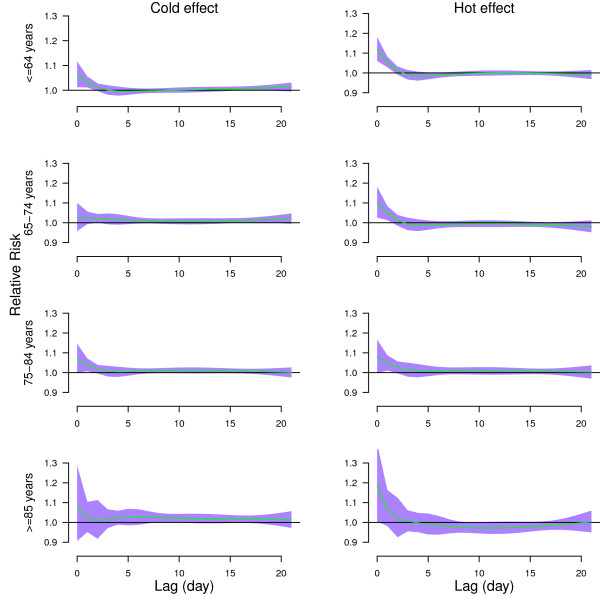
Results: We found non-linear effects of temperature on all mortality types and age groups. Both hot and cold temperatures resulted in immediate increase in all mortality types and age groups. Generally, the hot effects on all mortality types and age groups were short-term, while the cold effects lasted longer. The relative risk of non-external mortality associated with cold temperature (19.35°C, 1st percentile of temperature) relative to 24.7°C (25th percentile of temperature) was 1.29 (95% confidence interval (CI): 1.16, 1.44) for lags 0-21. The relative risk of non-external mortality associated with high temperature (31.7°C, 99th percentile of temperature) relative to 28°C (75th percentile of temperature) was 1.11 (95% CI: 1.00, 1.24) for lags 0-21.
Conclusion: This study indicates that exposure to both hot and cold temperatures were related to increased mortality. Both cold and hot effects occurred immediately but cold effects lasted longer than hot effects. This study provides useful data for policy makers to better prepare local responses to manage the impact of hot and cold temperatures on population health.
Figures
Similar articles
-
Multicity study of air pollution and mortality in Latin America (the ESCALA study).Res Rep Health Eff Inst. 2012 Oct;(171):5-86. Res Rep Health Eff Inst. 2012. PMID: 23311234
-
Associations between air temperature and cardio-respiratory mortality in the urban area of Beijing, China: a time-series analysis.Environ Health. 2011 May 25;10:51. doi: 10.1186/1476-069X-10-51. Environ Health. 2011. PMID: 21612647 Free PMC article.
-
Part 2. Association of daily mortality with ambient air pollution, and effect modification by extremely high temperature in Wuhan, China.Res Rep Health Eff Inst. 2010 Nov;(154):91-217. Res Rep Health Eff Inst. 2010. PMID: 21446212
-
Low and high air temperature and cardiovascular risk.Atherosclerosis. 2025 Jul;406:119238. doi: 10.1016/j.atherosclerosis.2025.119238. Epub 2025 May 13. Atherosclerosis. 2025. PMID: 40383648 Review.
-
A deadly harvest: the effects of cold on older people in the UK.Br J Community Nurs. 2007 Jan;12(1):23-6. doi: 10.12968/bjcn.2007.12.Sup5.29392. Br J Community Nurs. 2007. PMID: 17353808 Review.
Cited by
-
Aging Will Amplify the Heat-related Mortality Risk under a Changing Climate: Projection for the Elderly in Beijing, China.Sci Rep. 2016 Jun 20;6:28161. doi: 10.1038/srep28161. Sci Rep. 2016. PMID: 27320724 Free PMC article.
-
Association between out-patient visits and air pollution in Chiang Mai, Thailand: Lessons from a unique situation involving a large data set showing high seasonal levels of air pollution.PLoS One. 2022 Aug 18;17(8):e0272995. doi: 10.1371/journal.pone.0272995. eCollection 2022. PLoS One. 2022. PMID: 35980887 Free PMC article.
-
The characteristic of heat wave effects on coronary heart disease mortality in Beijing, China: a time series study.PLoS One. 2013 Sep 30;8(9):e77321. doi: 10.1371/journal.pone.0077321. eCollection 2013. PLoS One. 2013. PMID: 24098818 Free PMC article.
-
Exploring the effects of high temperature on mortality in four cities in the Philippines using various heat wave definitions in different mortality subgroups.Glob Health Action. 2017;10(1):1368969. doi: 10.1080/16549716.2017.1368969. Glob Health Action. 2017. PMID: 28914171 Free PMC article.
-
The association between temperature and mortality in tropical middle income Thailand from 1999 to 2008.Int J Biometeorol. 2014 Mar;58(2):203-15. doi: 10.1007/s00484-012-0597-8. Epub 2012 Oct 26. Int J Biometeorol. 2014. PMID: 23100101
References
-
- Glover M. Mortality during periods of excessive temperature. Public Health Rep. 1938;53:1122. doi: 10.2307/4582590. - DOI
Publication types
MeSH terms
LinkOut - more resources
Full Text Sources
