

Induction of pulmonary fibrosis by cerium oxide nanoparticles
- PMID: 22613087
- PMCID: PMC4697452
- DOI: 10.1016/j.taap.2012.05.005
Induction of pulmonary fibrosis by cerium oxide nanoparticles
Abstract
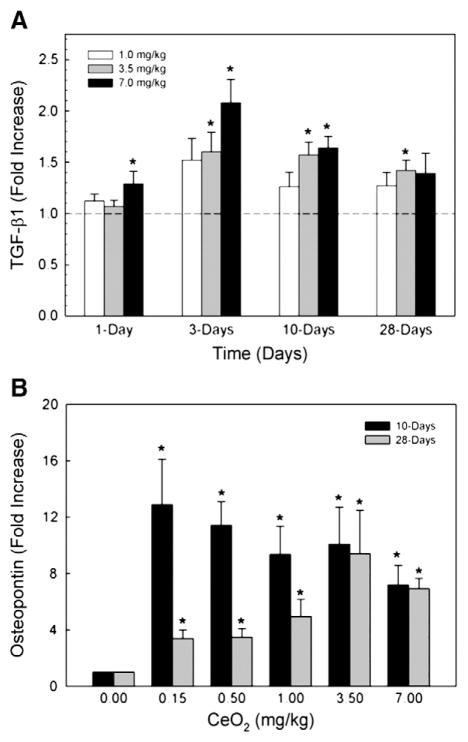
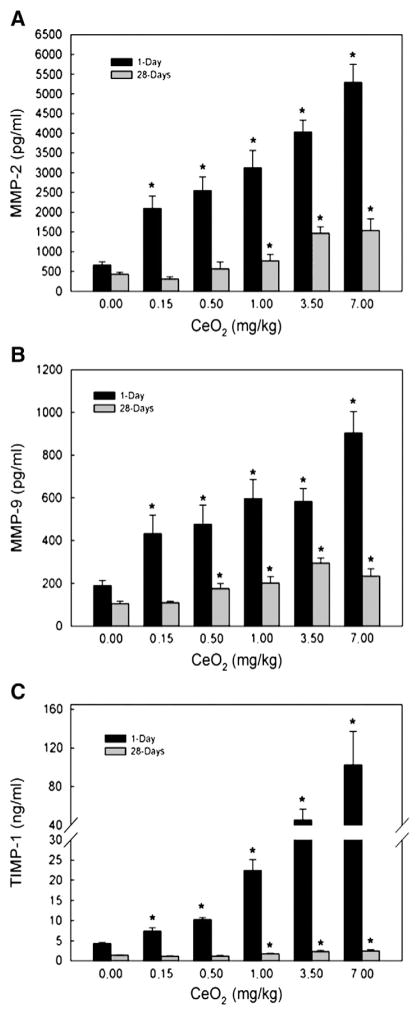
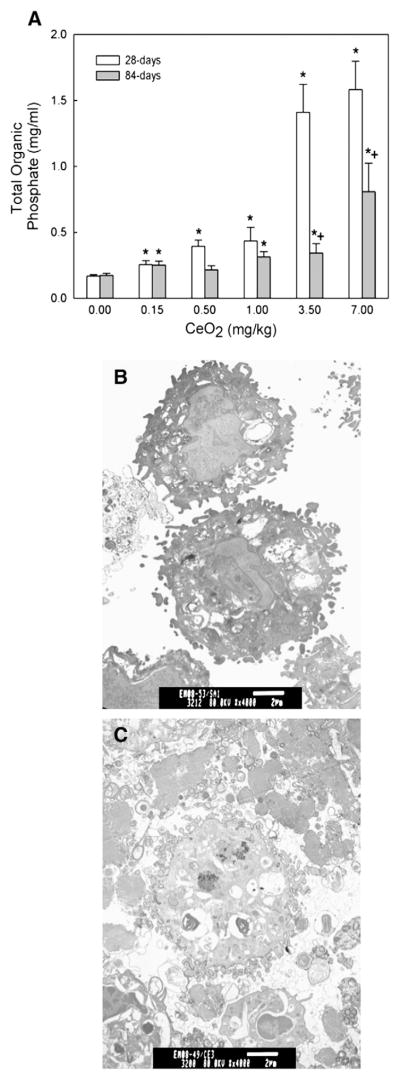
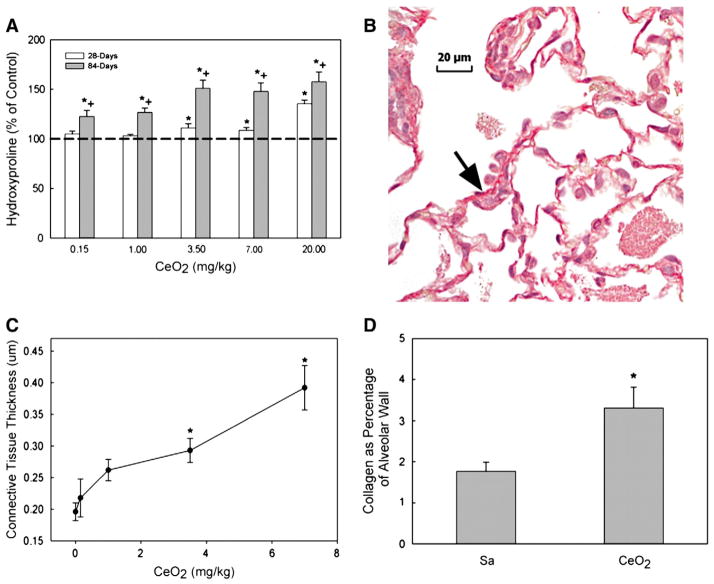
Cerium compounds have been used as a diesel engine catalyst to lower the mass of diesel exhaust particles, but are emitted as cerium oxide (CeO(2)) nanoparticles in the diesel exhaust. In a previous study, we have demonstrated a wide range of CeO(2)-induced lung responses including sustained pulmonary inflammation and cellular signaling that could lead to pulmonary fibrosis. In this study, we investigated the fibrogenic responses induced by CeO(2) in a rat model at various time points up to 84 days post-exposure. Male Sprague Dawley rats were exposed to CeO(2) by a single intratracheal instillation. Alveolar macrophages (AM) were isolated by bronchial alveolar lavage (BAL). AM-mediated cellular responses, osteopontin (OPN) and transform growth factor (TGF)-β1 in the fibrotic process were investigated. The results showed that CeO(2) exposure significantly increased fibrotic cytokine TGF-β1 and OPN production by AM above controls. The collagen degradation enzymes, matrix metalloproteinase (MMP)-2 and -9 and the tissue inhibitor of MMP were markedly increased in the BAL fluid at 1 day- and subsequently declined at 28 days after exposure, but remained much higher than the controls. CeO(2) induced elevated phospholipids in BAL fluid and increased hydroxyproline content in lung tissue in a dose- and time-dependent manner. Immunohistochemical analysis showed MMP-2, MMP-9 and MMP-10 expressions in fibrotic regions. Morphological analysis noted increased collagen fibers in the lungs exposed to a single dose of 3.5mg/kg CeO(2) and euthanized at 28 days post-exposure. Collectively, our studies show that CeO(2) induced fibrotic lung injury in rats, suggesting it may cause potential health effects.
Published by Elsevier Inc.
Conflict of interest statement
The authors declare that there are no conflicts of interest.
Figures


Similar articles
-
Interactive effects of cerium oxide and diesel exhaust nanoparticles on inducing pulmonary fibrosis.Toxicol Appl Pharmacol. 2014 Jul 15;278(2):135-47. doi: 10.1016/j.taap.2014.04.019. Epub 2014 May 2. Toxicol Appl Pharmacol. 2014. PMID: 24793434 Free PMC article.
-
Role of epithelial-mesenchymal transition (EMT) and fibroblast function in cerium oxide nanoparticles-induced lung fibrosis.Toxicol Appl Pharmacol. 2017 May 15;323:16-25. doi: 10.1016/j.taap.2017.03.015. Epub 2017 Mar 16. Toxicol Appl Pharmacol. 2017. PMID: 28315692 Free PMC article.
-
Effects of amorphous silica coating on cerium oxide nanoparticles induced pulmonary responses.Toxicol Appl Pharmacol. 2015 Oct 1;288(1):63-73. doi: 10.1016/j.taap.2015.07.012. Epub 2015 Jul 22. Toxicol Appl Pharmacol. 2015. PMID: 26210349 Free PMC article.
-
Cerium oxide nanoparticle-induced pulmonary inflammation and alveolar macrophage functional change in rats.Nanotoxicology. 2011 Sep;5(3):312-25. doi: 10.3109/17435390.2010.519835. Epub 2010 Oct 6. Nanotoxicology. 2011. PMID: 20925443
-
Inhaled diesel emissions generated with cerium oxide nanoparticle fuel additive induce adverse pulmonary and systemic effects.Toxicol Sci. 2014 Dec;142(2):403-17. doi: 10.1093/toxsci/kfu187. Epub 2014 Sep 19. Toxicol Sci. 2014. PMID: 25239632 Free PMC article.
Cited by
-
The effect of environmental chemicals on the tumor microenvironment.Carcinogenesis. 2015 Jun;36 Suppl 1(Suppl 1):S160-83. doi: 10.1093/carcin/bgv035. Carcinogenesis. 2015. PMID: 26106136 Free PMC article. Review.
-
The acute pulmonary and thrombotic effects of cerium oxide nanoparticles after intratracheal instillation in mice.Int J Nanomedicine. 2017 Apr 10;12:2913-2922. doi: 10.2147/IJN.S127180. eCollection 2017. Int J Nanomedicine. 2017. PMID: 28435267 Free PMC article.
-
Interactive effects of cerium oxide and diesel exhaust nanoparticles on inducing pulmonary fibrosis.Toxicol Appl Pharmacol. 2014 Jul 15;278(2):135-47. doi: 10.1016/j.taap.2014.04.019. Epub 2014 May 2. Toxicol Appl Pharmacol. 2014. PMID: 24793434 Free PMC article.
-
Role of epithelial-mesenchymal transition (EMT) and fibroblast function in cerium oxide nanoparticles-induced lung fibrosis.Toxicol Appl Pharmacol. 2017 May 15;323:16-25. doi: 10.1016/j.taap.2017.03.015. Epub 2017 Mar 16. Toxicol Appl Pharmacol. 2017. PMID: 28315692 Free PMC article.
-
A Stereological Study of the Toxic Effects of Cerium Oxide during Pregnancy on Kidney Tissues in Neonatal NMRI Mice.Oxid Med Cell Longev. 2020 Jun 23;2020:9132724. doi: 10.1155/2020/9132724. eCollection 2020. Oxid Med Cell Longev. 2020. PMID: 32685101 Free PMC article.
References
-
- Antonini JM, Hemenway DR, Davis GS. Quantitative image analysis of lung connective tissue in murine silicosis. Exp Lung Res. 2000;26:71–88. - PubMed
-
- Bartlett GR. Phosphorus assay in column chromatography. J Biol Chem. 1959;234:466–468. - PubMed
-
- Berman JS, Serlin D, Li X, Whitley G, Hayes J, Rishikof DC, Ricupero DA, Liaw L, Goetschkes M, O’Regan AW. Altered bleomycin-induced lung fibrosis in osteopontin-deficient mice. Am J Physiol Lung Cell Mol Physiol. 2004;2868i:L1311–L1318. - PubMed
-
- Bonniaud P, Kolb M, Galt T, Robertson J, Robbins C, Stampfli M, Lavery C, Margetts PJ, Roberts AB, Gauldie J. Smad3 null mice develop airspace enlargement and are resistant to TGF-beta-mediated pulmonary fibrosis. J Immunol. 2004;173:2099–2108. - PubMed
-
- Corbel M, Boichot E, Lagente V. Role of gelatinases MMP-2 and MMP-9 in tissue remodeling following acute lung injury. Braz J Med Biol Res. 2000;33:749–754. - PubMed
MeSH terms
Substances
Grants and funding
LinkOut - more resources
Full Text Sources
Medical
Research Materials
Miscellaneous
