Genome-wide expression and methylation profiling in the aged rodent brain due to early-life Pb exposure and its relevance to aging
- PMID: 22613225
- PMCID: PMC3389195
- DOI: 10.1016/j.mad.2012.05.003
Genome-wide expression and methylation profiling in the aged rodent brain due to early-life Pb exposure and its relevance to aging
Abstract
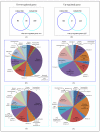
In this study, we assessed global gene expression patterns in adolescent mice exposed to lead (Pb) as infants and their aged siblings to identify reprogrammed genes. Global expression on postnatal day 20 and 700 was analyzed and genes that were down- and up-regulated (≥2 fold) were identified, clustered and analyzed for their relationship to DNA methylation. About 150 genes were differentially expressed in old age. In normal aging, we observed an up-regulation of genes related to the immune response, metal-binding, metabolism and transcription/transduction coupling. Prior exposure to Pb revealed a repression in these genes suggesting that disturbances in developmental stages of the brain compromise the ability to defend against age-related stressors, thus promoting the neurodegenerative process. Overexpression and repression of genes corresponded with their DNA methylation profile.
Published by Elsevier Ireland Ltd.
Figures


Similar articles
-
Histone acetylation maps in aged mice developmentally exposed to lead: epigenetic drift and Alzheimer-related genes.Epigenomics. 2018 May;10(5):573-583. doi: 10.2217/epi-2017-0143. Epub 2018 May 3. Epigenomics. 2018. PMID: 29722544 Free PMC article.
-
Integration of genome-wide expression and methylation data: relevance to aging and Alzheimer's disease.Neurotoxicology. 2012 Dec;33(6):1450-1453. doi: 10.1016/j.neuro.2012.06.008. Epub 2012 Jun 25. Neurotoxicology. 2012. PMID: 22743688 Free PMC article.
-
Sex- and tissue-specific methylome changes in brains of mice perinatally exposed to lead.Neurotoxicology. 2015 Jan;46:92-100. doi: 10.1016/j.neuro.2014.12.004. Epub 2014 Dec 18. Neurotoxicology. 2015. PMID: 25530354 Free PMC article.
-
Early life exposure to lead (Pb) and changes in DNA methylation: relevance to Alzheimer's disease.Rev Environ Health. 2019 Jun 26;34(2):187-195. doi: 10.1515/reveh-2018-0076. Rev Environ Health. 2019. PMID: 30710487 Review.
-
Early-life Pb exposure as a potential risk factor for Alzheimer's disease: are there hazards for the Mexican population?J Biol Inorg Chem. 2019 Dec;24(8):1285-1303. doi: 10.1007/s00775-019-01739-1. Epub 2019 Nov 26. J Biol Inorg Chem. 2019. PMID: 31773268 Review.
Cited by
-
Quality control and statistical modeling for environmental epigenetics: a study on in utero lead exposure and DNA methylation at birth.Epigenetics. 2015;10(1):19-30. doi: 10.4161/15592294.2014.989077. Epub 2015 Jan 27. Epigenetics. 2015. PMID: 25580720 Free PMC article.
-
Therapeutic implications of how TNF links apolipoprotein E, phosphorylated tau, α-synuclein, amyloid-β and insulin resistance in neurodegenerative diseases.Br J Pharmacol. 2018 Oct;175(20):3859-3875. doi: 10.1111/bph.14471. Epub 2018 Sep 6. Br J Pharmacol. 2018. PMID: 30097997 Free PMC article. Review.
-
Lead exposure disrupts global DNA methylation in human embryonic stem cells and alters their neuronal differentiation.Toxicol Sci. 2014 May;139(1):142-61. doi: 10.1093/toxsci/kfu028. Epub 2014 Feb 11. Toxicol Sci. 2014. PMID: 24519525 Free PMC article.
-
A global perspective on the influence of environmental exposures on the nervous system.Nature. 2015 Nov 19;527(7578):S187-92. doi: 10.1038/nature16034. Nature. 2015. PMID: 26580326 Free PMC article. Review.
-
Environmental chemicals and DNA methylation in adults: a systematic review of the epidemiologic evidence.Clin Epigenetics. 2015 Apr 29;7(1):55. doi: 10.1186/s13148-015-0055-7. eCollection 2015. Clin Epigenetics. 2015. PMID: 25984247 Free PMC article. Review.
References
-
- Bakheet SA, Basha MR, Cai H, Zawia NH. Lead exposure: expression and activity levels of Oct-2 in the developing rat brain. Toxicol Sci. 2007;95(2):436–442. - PubMed
-
- Basha MR, Wei W, Brydie M, Razmiafshari M, Zawia NH. Lead-induced developmental perturbations in hippocampal Sp1 DNA-binding are prevented by zinc supplementation: in vivo evidence for Pb and Zn competition. Int J Devel Neurosci. 2003;21(1):1–12. - PubMed
-
- Basha MR, Murali M, Siddiqi HK, Ghosal K, Siddiqi OK, Lashuel HA, Ge YW, Lahiri DK, Zawia NH. Lead (Pb) exposure and its effects on APP proteolysis and Abeta aggregation. FASEB J. 2005b;19(14):2083–2084. - PubMed
Publication types
MeSH terms
Substances
Grants and funding
LinkOut - more resources
Full Text Sources
Medical

