

A neutral theory of genome evolution and the frequency distribution of genes
- PMID: 22613814
- PMCID: PMC3386021
- DOI: 10.1186/1471-2164-13-196
A neutral theory of genome evolution and the frequency distribution of genes
Abstract
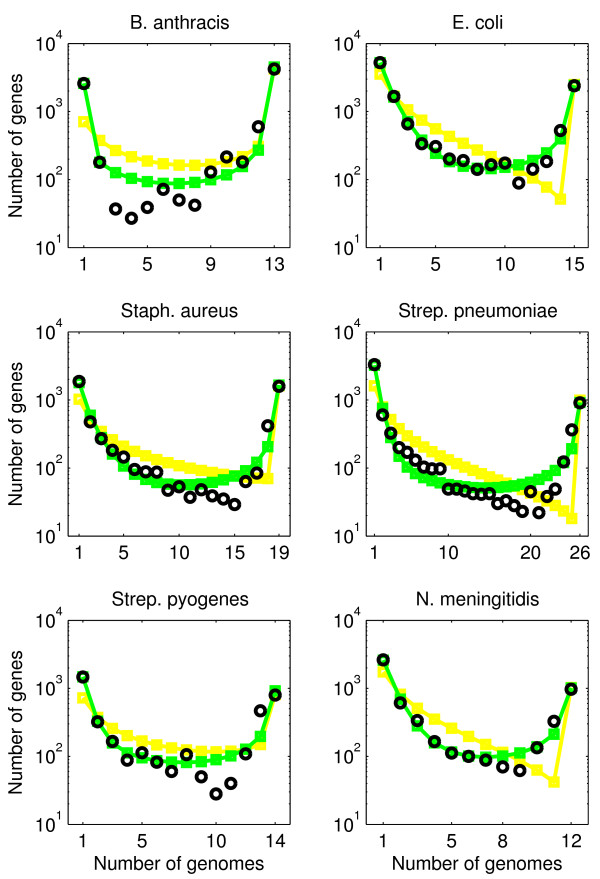
Background: The gene composition of bacteria of the same species can differ significantly between isolates. Variability in gene composition can be summarized in terms of gene frequency distributions, in which individual genes are ranked according to the frequency of genomes in which they appear. Empirical gene frequency distributions possess a U-shape, such that there are many rare genes, some genes of intermediate occurrence, and many common genes. It would seem that U-shaped gene frequency distributions can be used to infer the essentiality and/or importance of a gene to a species. Here, we ask: can U-shaped gene frequency distributions, instead, arise generically via neutral processes of genome evolution?
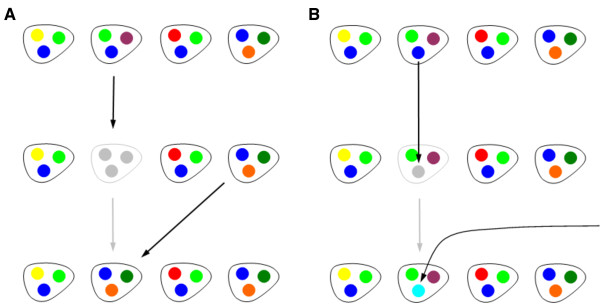
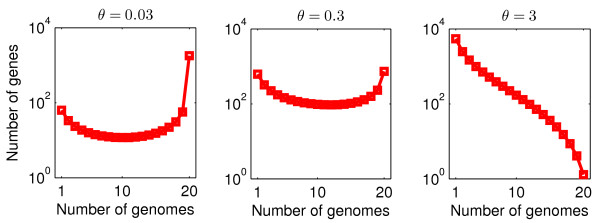
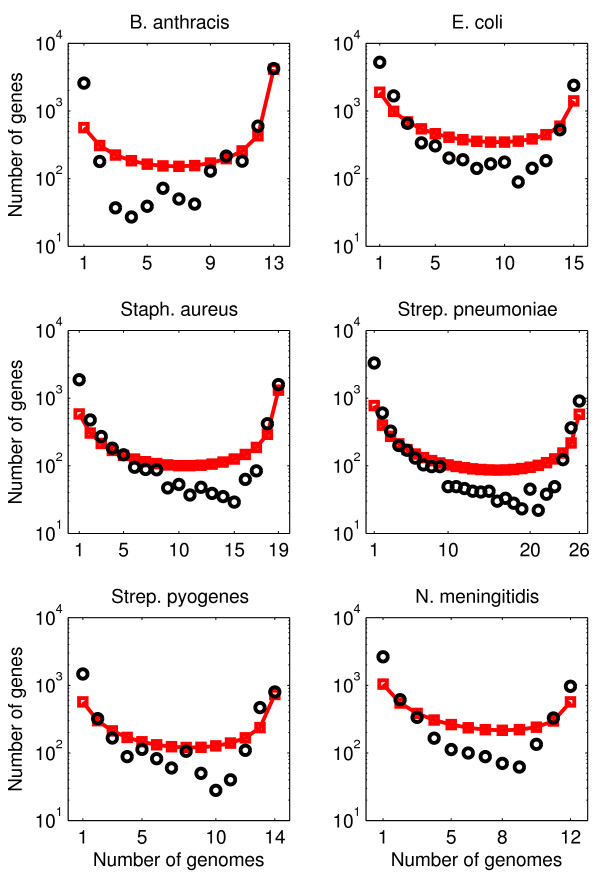
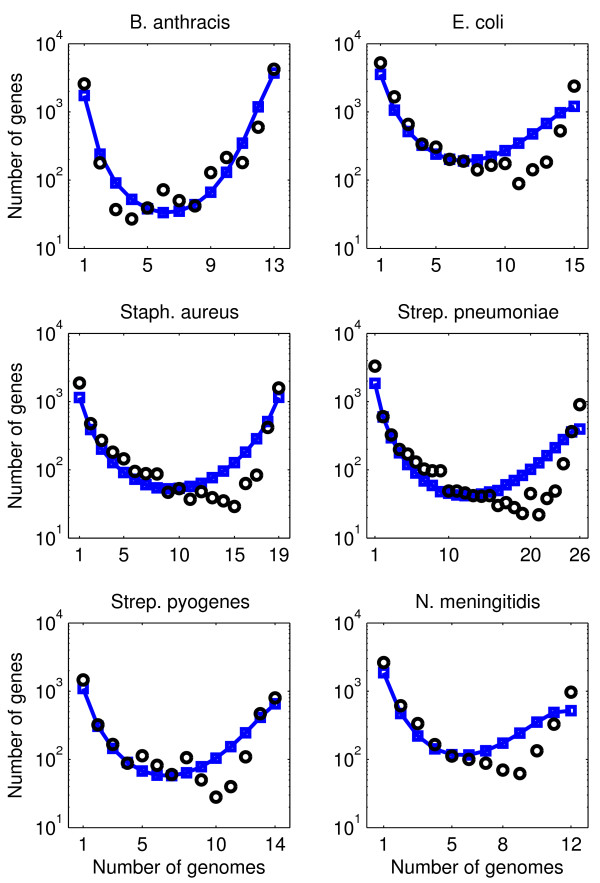
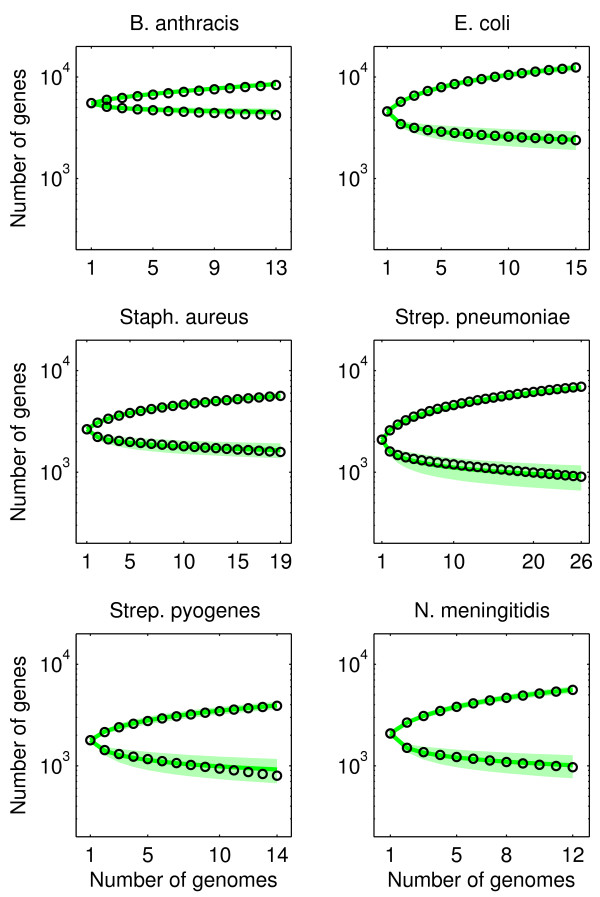
Results: We introduce a neutral model of genome evolution which combines birth-death processes at the organismal level with gene uptake and loss at the genomic level. This model predicts that gene frequency distributions possess a characteristic U-shape even in the absence of selective forces driving genome and population structure. We compare the model predictions to empirical gene frequency distributions from 6 multiply sequenced species of bacterial pathogens. We fit the model with constant population size to data, matching U-shape distributions albeit without matching all quantitative features of the distribution. We find stronger model fits in the case where we consider exponentially growing populations. We also show that two alternative models which contain a "rigid" and "flexible" core component of genomes provide strong fits to gene frequency distributions.
Conclusions: The analysis of neutral models of genome evolution suggests that U-shaped gene frequency distributions provide less information than previously suggested regarding gene essentiality. We discuss the need for additional theory and genomic level information to disentangle the roles of evolutionary mechanisms operating within and amongst individuals in driving the dynamics of gene distributions.
Figures
References
-
- Tettelin H, Masignani V, Cieslewicz MJ, Donati C, Medini D, Ward NL, Angiuoli SV, Crabtree J, Jones AL, Durkin AS, DeBoy RT, Davidsen TM, Mora M, Scarselli M, Margarit, Peterson JD, Hauser CR, Sundaram JP, Nelson WC, Madupu R, Brinkac LM, Dodson RJ, Rosovitz MJ, Sullivan SA, Daugherty SC, Haft DH, Selengut J, Gwinn ML, Zhou L, Zafar N, Khouri H, Radune D, Dimitrov G, Watkins K, O'Connor KJB, Smith S, Utterback TR, White O, Rubens CE, Grandi G, Madoff LC, Kasper DL, Telford JL, Wessels MR, Rappuoli R, Fraser CM. Genome analysis of multiple pathogenic isolates of Streptococcus agalactiae: Implications for the microbial "pan-genome. Proc Natl Acad Sci USA. 2005;102(39):13950–13955. doi: 10.1073/pnas.0506758102. - DOI - PMC - PubMed
-
- Hotopp JDC, Grifantini R, Kumar N, Tzeng YLL, Fouts D, Frigimelica E, Draghi M, Giuliani MMM, Rappuoli R, Stephens DS, Grandi G, Tettelin H. Comparative genomics of Neisseria meningitidis: core genome, islands of horizontal transfer and pathogen-specific genes. Microbiology. 2006;152(12):3733–3749. doi: 10.1099/mic.0.29261-0. - DOI - PubMed
-
- Hiller NL, Janto B, Hogg JS, Boissy R, Yu S, Powell E, Keefe R, Ehrlich NE, Shen K, Hayes J, Barbadora K, Klimke W, Dernovoy D, Tatusova T, Parkhill J, Bentley SD, Post JC, Ehrlich GD, Hu FZ. Comparative genomic analyses of seventeen Streptococcus pneumoniae strains: insights into the pneumococcal supragenome. J Bacteriol. 2007;189(22):8186–8195. doi: 10.1128/JB.00690-07. - DOI - PMC - PubMed
-
- Rasko DA, Rosovitz MJ, Myers GSA, Mongodin EF, Fricke WF, Gajer P, Crabtree J, Sebaihia M, Thomson NR, Chaudhuri R, Henderson IR, Sperandio V, Ravel J. The pangenome structure of Escherichia coli: comparative genomic analysis of E. coli commensal and pathogenic isolates. J Bacteriol. 2008;190(20):6881–6893. doi: 10.1128/JB.00619-08. - DOI - PMC - PubMed
Publication types
MeSH terms
LinkOut - more resources
Full Text Sources
