

Epigenetic transgenerational inheritance of altered stress responses
- PMID: 22615374
- PMCID: PMC3384163
- DOI: 10.1073/pnas.1118514109
Epigenetic transgenerational inheritance of altered stress responses
Abstract
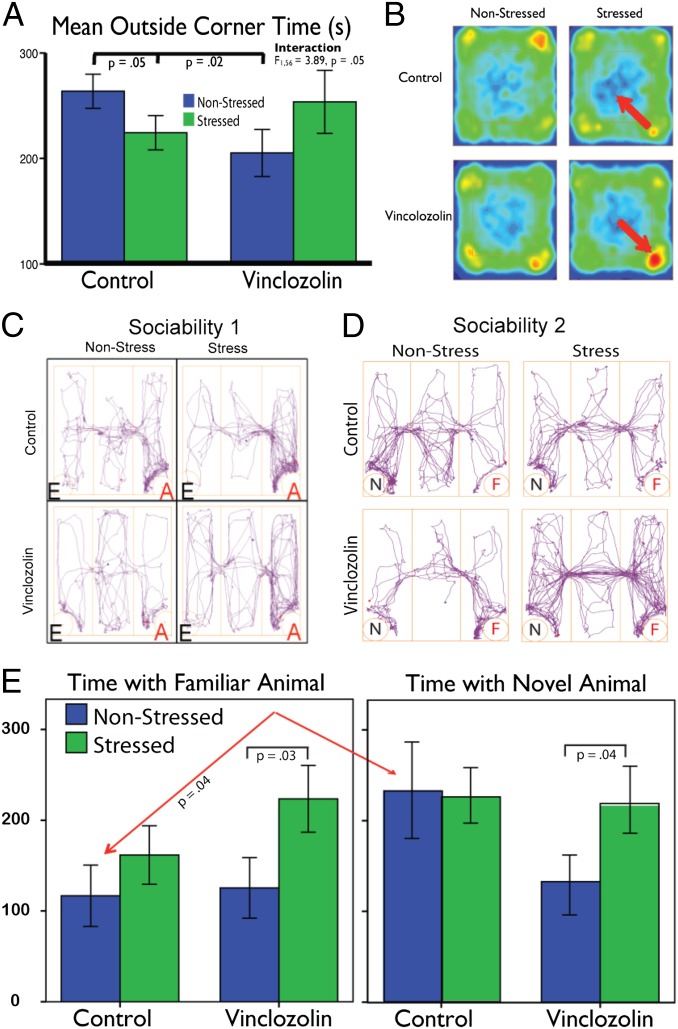
Ancestral environmental exposures have previously been shown to promote epigenetic transgenerational inheritance and influence all aspects of an individual's life history. In addition, proximate life events such as chronic stress have documented effects on the development of physiological, neural, and behavioral phenotypes in adulthood. We used a systems biology approach to investigate in male rats the interaction of the ancestral modifications carried transgenerationally in the germ line and the proximate modifications involving chronic restraint stress during adolescence. We find that a single exposure to a common-use fungicide (vinclozolin) three generations removed alters the physiology, behavior, metabolic activity, and transcriptome in discrete brain nuclei in descendant males, causing them to respond differently to chronic restraint stress. This alteration of baseline brain development promotes a change in neural genomic activity that correlates with changes in physiology and behavior, revealing the interaction of genetics, environment, and epigenetic transgenerational inheritance in the shaping of the adult phenotype. This is an important demonstration in an animal that ancestral exposure to an environmental compound modifies how descendants of these progenitor individuals perceive and respond to a stress challenge experienced during their own life history.
Conflict of interest statement
The authors declare no conflict of interest.
Figures
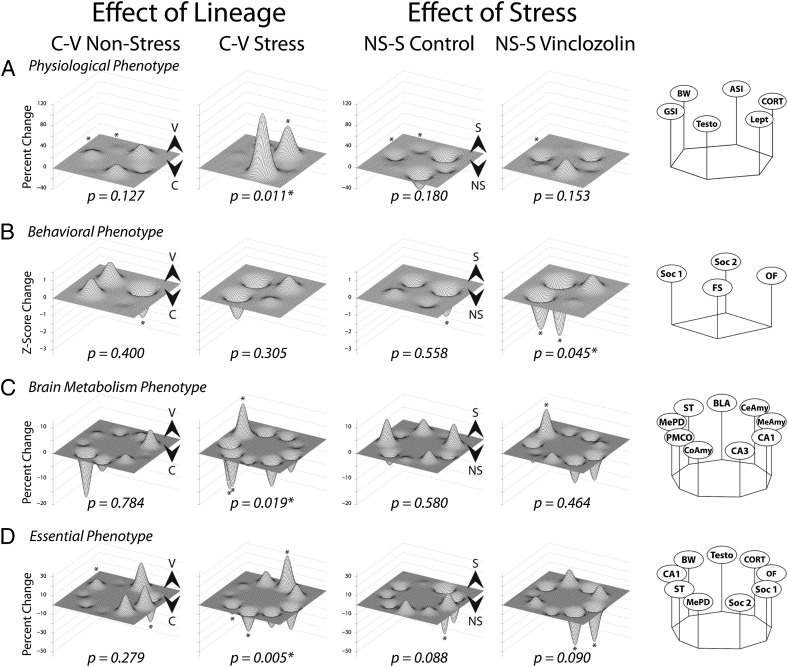
 ) males, whereas a valley indicates a greater result in C-L (C
 ) males. Rightmost columns depict effects of stress (difference between nonstress and stress) in C-L and V-L males. A peak for a trait indicates a greater result in stress (S
 ) conditions, whereas a valley indicates a greater result in nonstress (NS
 ) conditions. Nodes represent group means of percentage maximum or Z scores (see
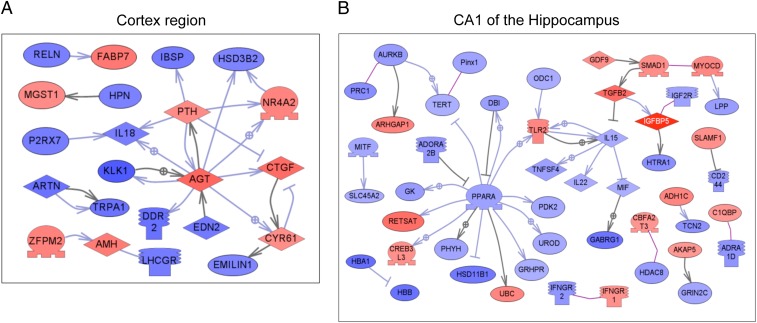
Comment in
-
The role of epigenetic inheritance in stress regulation.Epigenomics. 2012 Oct;4(5):483. doi: 10.2217/epi.12.48. Epigenomics. 2012. PMID: 23130829 No abstract available.
References
-
- Gilbert SF. Ecological developmental biology: Developmental biology meets the real world. Dev Biol. 2001;233(1):1–12. - PubMed
-
- Waddington CH. The epigenotype. Endeavour. 1942;1:18–20.
Publication types
MeSH terms
Substances
Associated data
- Actions
Grants and funding
LinkOut - more resources
Full Text Sources
Other Literature Sources
Molecular Biology Databases
