Notch controls the magnitude of T helper cell responses by promoting cellular longevity
- PMID: 22615412
- PMCID: PMC3384214
- DOI: 10.1073/pnas.1206044109
Notch controls the magnitude of T helper cell responses by promoting cellular longevity
Abstract
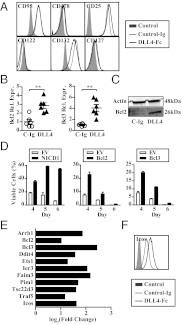
Generation of effective immune responses requires expansion of rare antigen-specific CD4(+) T cells. The magnitude of the responding population is ultimately determined by proliferation and survival. Both processes are tightly controlled to limit responses to innocuous antigens. Sustained expansion occurs only when innate immune sensors are activated by microbial stimuli or by adjuvants, which has important implications for vaccination. The molecular identity of the signals controlling sustained T-cell responses is not fully clear. Here, we describe a prominent role for the Notch pathway in this process. Coactivation of Notch allows accumulation of far greater numbers of activated CD4(+) T cells than stimulation via T-cell receptor and classic costimulation alone. Notch does not overtly affect cell cycle entry or progression of CD4(+) T cells. Instead, Notch protects activated CD4(+) T cells against apoptosis after an initial phase of clonal expansion. Notch induces a broad antiapoptotic gene expression program that protects against intrinsic, as well as extrinsic, apoptosis pathways. Both Notch1 and Notch2 receptors and the canonical effector RBPJ (recombination signal binding protein for immunoglobulin kappa J region) are involved in this process. Correspondingly, CD4(+) T-cell responses to immunization with protein antigen are strongly reduced in mice lacking these components of the Notch pathway. Our findings, therefore, show that Notch controls the magnitude of CD4(+) T-cell responses by promoting cellular longevity.
Conflict of interest statement
The authors declare no conflict of interest.
Figures


Similar articles
-
Engagement of activated Notch signalling in collagen II-specific T helper type 1 (Th1)- and Th17-type expansion involving Notch3 and Delta-like1.Clin Exp Immunol. 2011 Apr;164(1):66-71. doi: 10.1111/j.1365-2249.2010.04310.x. Epub 2011 Jan 14. Clin Exp Immunol. 2011. PMID: 21235539 Free PMC article.
-
Notch signaling regulates follicular helper T cell differentiation.J Immunol. 2013 Sep 1;191(5):2344-50. doi: 10.4049/jimmunol.1300643. Epub 2013 Aug 5. J Immunol. 2013. PMID: 23918982
-
Notch1, Notch2, and Epstein-Barr virus-encoded nuclear antigen 2 signaling differentially affects proliferation and survival of Epstein-Barr virus-infected B cells.Blood. 2009 May 28;113(22):5506-15. doi: 10.1182/blood-2008-11-190090. Epub 2009 Apr 1. Blood. 2009. PMID: 19339697
-
The role of Notch in the differentiation of CD4⁺ T helper cells.Curr Top Microbiol Immunol. 2012;360:115-34. doi: 10.1007/82_2012_227. Curr Top Microbiol Immunol. 2012. PMID: 22653552 Review.
-
Canonical and non-canonical Notch signaling in CD4⁺ T cells.Curr Top Microbiol Immunol. 2012;360:99-114. doi: 10.1007/82_2012_233. Curr Top Microbiol Immunol. 2012. PMID: 22695917 Review.
Cited by
-
Notch signaling maintains T cell memories.Nat Med. 2015 Jan;21(1):16-8. doi: 10.1038/nm.3784. Nat Med. 2015. PMID: 25569546 No abstract available.
-
Tissue-resident memory T cells: decoding intra-organ diversity with a gut perspective.Inflamm Regen. 2024 Apr 17;44(1):19. doi: 10.1186/s41232-024-00333-6. Inflamm Regen. 2024. PMID: 38632596 Free PMC article. Review.
-
Diversity, function, and transcriptional regulation of gut innate lymphocytes.Front Immunol. 2013 Mar 4;4:22. doi: 10.3389/fimmu.2013.00022. eCollection 2013. Front Immunol. 2013. PMID: 23508190 Free PMC article.
-
T Cell-Restricted Notch Signaling Contributes to Pulmonary Th1 and Th2 Immunity during Cryptococcus neoformans Infection.J Immunol. 2017 Jul 15;199(2):643-655. doi: 10.4049/jimmunol.1601715. Epub 2017 Jun 14. J Immunol. 2017. PMID: 28615417 Free PMC article.
-
T cell-specific notch inhibition blocks graft-versus-host disease by inducing a hyporesponsive program in alloreactive CD4+ and CD8+ T cells.J Immunol. 2013 Jun 1;190(11):5818-28. doi: 10.4049/jimmunol.1203452. Epub 2013 May 1. J Immunol. 2013. PMID: 23636056 Free PMC article.
References
-
- Jenkins MK, et al. In vivo activation of antigen-specific CD4 T cells. Annu Rev Immunol. 2001;19:23–45. - PubMed
-
- Vella AT, McCormack JE, Linsley PS, Kappler JW, Marrack P. Lipopolysaccharide interferes with the induction of peripheral T cell death. Immunity. 1995;2:261–270. - PubMed
-
- Krammer PH, Arnold R, Lavrik IN. Life and death in peripheral T cells. Nat Rev Immunol. 2007;7:532–542. - PubMed
Publication types
MeSH terms
Substances
Associated data
- Actions
Grants and funding
LinkOut - more resources
Full Text Sources
Other Literature Sources
Molecular Biology Databases
Research Materials
Miscellaneous

