. 2012 Aug 15;590(16):3771-86.
doi: 10.1113/jphysiol.2012.234740. Epub 2012 May 21.

Plasticity of NMDA receptor-mediated excitatory postsynaptic currents at perforant path inputs to dendrite-targeting interneurons

Affiliations

Plasticity of NMDA receptor-mediated excitatory postsynaptic currents at perforant path inputs to dendrite-targeting interneurons

Sarah C Harney et al. J Physiol. .

Abstract

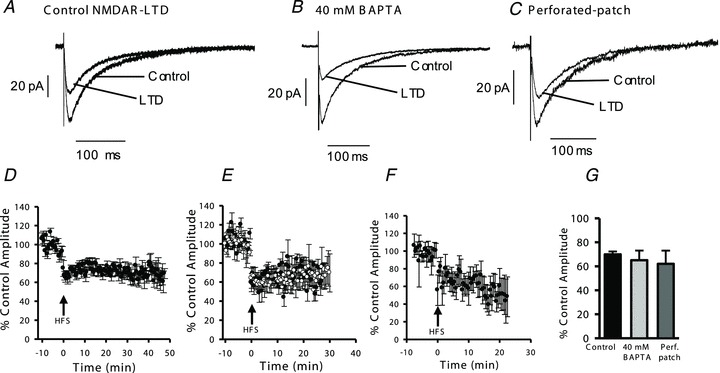
Synaptic plasticity of NMDA receptors (NMDARs) has been recently described in a number of brain regions and we have previously characterised LTP and LTD of glutamatergic NMDA receptor-mediated EPSCs (NMDAR-EPSCs) in granule cells of dentate gyrus. The functional significance of NMDAR plasticity at perforant path synapses on hippocampal network activity depends on whether this is a common feature of perforant path synapses on all postsynaptic target cells or if this plasticity occurs only at synapses on principal cells. We recorded NMDAR-EPSCs at medial perforant path synapses on interneurons in dentate gyrus which had significantly slower decay kinetics compared to those recorded in granule cells. NMDAR pharmacology in interneurons was consistent with expression of both GluN2B- and GluN2D-containing receptors. In contrast to previously described high frequency stimulation-induced bidirectional plasticity of NMDAR-EPSCs in granule cells, only LTD of NMDAR-EPSCs was induced in interneurons in our standard experimental conditions. In interneurons, LTD of NMDAR-EPSCs was associated with a loss of sensitivity to a GluN2D-selective antagonist and was inhibited by the actin stabilising agent, jasplakinolide. While LTP of NMDAR-EPSCs can be readily induced in granule cells, this form of plasticity was only observed in interneurons when extracellular calcium was increased above physiological concentrations during HFS or when PKC was directly activated by phorbol ester, suggesting that opposing forms of plasticity at inputs to interneurons and principal cells may act to regulate granule cell dendritic integration and processing.


Figures

Figure 1
Figure 1. Medial perforant path-evoked NMDAR-EPSCs recorded in interneurons have slow decay kinetics compared to those recorded in granule cells in dentate gyrus
A, reconstruction of a representative interneuron, illustrating the location of the axon (shown in red) within the molecular layer. B, averaged EPSC traces recorded from a granule cell (red) and an inhibitory interneuron (black). C, histogram displaying the distributions of averaged weighted decay time constants in granule cells and interneurons. The distributions were fitted with a single Gaussian function. Superimposed lines illustrate the cumulative probability distributions for weighted decay time constants (τw) for granule cells (red) and interneurons (black). The distribution of time constants was significantly shifted toward slower values for interneurons; KS test, P < 0.001, n = 27 GCs and 58 INs. D, averaged weighted decay time constants for NMDAR-EPSCs recorded from granule cells and interneurons; *P < 0.001, n = 27 GCs and 58 INs. E, input resistance plotted against NMDAR-EPSC decay time constant showed no significant correlation for either interneurons (filled symbols) or granule cells (open symbols). F, 10–90% rise time plotted against τw was significantly correlated for granule cells (P = 0.01) but not for interneurons (P = 0.12). G, τw plotted against EPSC amplitude was not significantly correlated for granule cells (P = 0.56) but showed a significant negative correlation for interneurons (P = 0.002).
Figure 2
Figure 2. Different paired-pulse plasticity at medial perforant path synapses on granule cells and interneurons
A, NMDAR-EPSCs recorded from a granule cell in response to single and paired-pulse stimulation (100 ms inter-stimulus interval) displaying paired pulse depression. B, NMDAR-EPSCs recorded from an interneuron in response to single and paired-pulse stimulation displaying paired pulse facilitation. The amplitude of the second EPSC was measured following subtraction of the averaged first EPSC evoked by a single stimulus, to remove the persisting postsynaptic current. C, bar graph showing paired pulse ratio for both cell types; *P < 0.001, unpaired t test, n = 4 GCs and 21 INs.
Figure 3
Figure 3. NMDAR-EPSCs in inhibitory interneurons are sensitive to GluN2B- and GluN2D-selective antagonists
A, traces of averaged NMDAR-EPSCs displaying depression in the presence of the GluN2B-selective antagonist ifenprodil (3 μm). B and C, traces showing averaged NMDAR-EPSCs depressed by the GluN2D-selective antagonists UBP141 (3 μm) and PPDA (0.5 μm). DF, plots illustrating averaged EPSC amplitude during application of ifenprodil, UBP141 and PPDA (n = 8 for ifenprodil, 11 for UBP141 and 6 for PPDA). G, bar graph showing averaged EPSC amplitude in the presence of antagonists; all 3 compounds depressed EPSCs to a similar extent.
Figure 4
Figure 4. HFS induces LTD of NMDAR-EPSCs in interneurons and this form of LTD is insensitive to strong intracellular Ca2+ buffering
A, traces of averaged EPSCs in control conditions (recorded with standard intracellular solution containing 0.2 mm EGTA) and following induction of LTD by HFS stimulation. B, traces showing EPSCs recorded in control conditions (using intracellular solution containing 40 mm BAPTA) and following induction of LTD. C, traces showing EPSCs recorded using the perforated-patch configuration during baseline recording and after HFS. D, HFS-induced LTD of NMDAR EPSCs recorded using standard intracellular solution containing 0.2 mm EGTA (n = 21). E, plots illustrating LTD induced by HFS in interneurons recorded using intracellular solution containing 40 mm BAPTA (open symbols, n = 8) and interleaved controls recorded using standard intracellular solution (filled symbols, n = 6). F, in recordings made using the perforated patch configuration HFS induced LTD that was similar to LTD observed in whole-cell recordings. G, bar graph illustrating averaged EPSC amplitudes following induction of LTD. There was no significant difference in the magnitude of LTD recorded with 40 mm BAPTA intracellular (ANOVA, P = 0.49) or in perforated patch recordings (ANOVA, P = 0.5) compared to controls recorded with standard intracellular solution (n = 21 controls, 8 BAPTA and 5 perforated patch).
Figure 5
Figure 5. LTD of NMDAR-EPSCs is associated with a loss of inhibition by the GluN2D-selective antagonist PPDA
A, averaged EPSCs recorded in control conditions, following induction of LTD and with subsequent application of PPDA (0.5 μm), which had no effect when applied after LTD induction. B, averaged EPSCs from interleaved controls showing inhibition of EPSCs by 0.5 μm PPDA. C, graph illustrating HFS-induced LTD of NMDAR-EPSCs. PPDA had no effect on EPSC amplitude when applied 10 min following induction of LTD. D, graph showing NMDAR-EPSC amplitude in experiments interleaved with those in C. PPDA application reversibly depressed NMDAR-EPSCs by 40% in slices which had not undergone HFS. E, bar graph showing averaged EPSC amplitudes following LTD induction, following LTD induction and subsequent perfusion of PPDA and in PPDA without prior induction of LTD (n = 5 for LTD + PPDA and 6 for PPDA alone).
Figure 6
Figure 6. Actin-depolymerisation is essential for LTD of NMDAR-EPSCs
A, averaged control EPSCs and following HFS, recorded with 2 μm jasplakinolide (Jpk) in the intracellular solution. B, averaged EPSCs from interleaved controls with the vehicle, 0.2% DMSO in the intracellular solution during baseline recordings and following HFS. C, averaged EPSCs recorded with jasplakinolide in the intracellular solution. Traces show EPSCs recorded during the first 10 min and after 50–60 min of recording. D, intracellular jasplakinolide prevented induction of LTD by HFS. Plot shows no change in averaged EPSC amplitude following HFS. E, control experiments, interleaved with those shown in D where 0.2% DMSO was added to the intracellular solution, displaying normal LTD of NMDAR-EPSCs. F, plot showing NMDAR-EPSC amplitude during recordings with jasplakinolide in the intracellular solution, which did not significantly alter NMDAR-EPSCs after whole-cell recording for up to 60 min. G, bar graph illustrating averaged EPSC amplitudes following HFS with intracellular solution containing jasplakinolide or 0.2% DMSO and following 1 h recording with intracellular jasplakinolide alone; *P < 0.05 vs. control, n = 5 for HFS/Jpk, 6 for HFS/DMSO and 6 for Jpk/60 min.
Figure 7
Figure 7. LTP of NMDAR-EPSCs can be induced in interneurons by HFS delivered in the presence of elevated extracellular Ca2+ (10 mm) and this form of LTP is abolished by strong postsynaptic Ca2+ buffering
A, averaged EPSCs recorded in control conditions and following HFS in the presence of transiently elevated extracellular Ca2+. Control and post-HFS EPSCs were recorded in normal ACSF containing 2 mm Ca2+. B, traces show averaged EPSCs recorded in control conditions using intracellular solution containing 40 mm BAPTA and following HFS delivered in the presence of elevated extracellular Ca2+. C, LTP of NMDAR-EPSCs was induced when HFS was delivered during a transient (5 min) elevation of extracellular Ca2+ from 2 mm to 10 mm. Following return to normal ACSF containing 2 mm Ca2+, EPSCs remained strongly potentiated for the duration of recordings. D, strong intracellular Ca2+ buffering with 40 mm BAPTA in the postsynaptic cell prevented the induction of LTP by the HFS/high Ca2+ protocol, resulting in a transient enhancement of EPSC amplitude followed by depression. E, plot showing LTD induced by HFS, in normal, 2 mm Ca2+-containing ACSF, in interneurons recorded with 10 μm carboxyeosin (CBE) in the intracellular solution. F, bar graph showing averaged NMDAR-EPSC amplitudes following the HFS/high Ca2+ LTP induction protocol using normal intracellular solution and intracellular containing 40 mm BAPTA and following the standard HFS protocol in cells recorded with 10 μm carboxyeosin intracellular (n = 9 for control high Ca2+/HFS, 8 for cells recorded with BAPTA and 5 for cells recorded with carboxyeosin).
Figure 8
Figure 8. Direct activation of PKC induces LTP of NMDAR-EPSCs
A, averaged traces showing NMDAR-EPSCS in control conditions and following a 20 min incubation with the phorbol ester, PMA (100 nM). B, averaged traces showing NMDAR-EPSCS in control conditions, recorded with the PKC inhibitory peptide PKC19−36 (10 μm) in the intracellular solution which abolished potentiation induced by PMA. C, plots illustrate potentiation of NMDAR-EPSC amplitude induced by PMA in recordings using standard intracellular solution (filled symbols, n = 6) and this potentiation was abolished in recordings with PKC19−36 in the intracellular solution (open symbols, n = 6). D, bar graph summarises NMDAR-EPSC amplitudes following washout of PMA for both controls and recordings with PKC19−36 in the intracellular solution.
Figure 9
Figure 9. Inhibition of group II mGluRs unmasks LTP in a subset of interneurons
A, averaged EPSCs recorded in 1 μm LY341495 displaying potentiation following HFS. B, averaged EPSCs recorded in 1 μm LY341495 from interneurons displaying LTD following HFS. C, averaged EPSCs recorded in 100 μm LY341495 displaying potentiation following HFS. D, averaged EPSCs recorded in 100 μm LY341495 from interneurons displaying LTD following HFS. E, plot summarising changes in mean NMDAR EPSC amplitude after HFS for all cells recorded in 1 μm LY341495, EPSCs in 4 interneurons were potentiated (green symbols) while depression was observed in the remaining 4 cells (black symbols). F, bar graph summarising the changes in NMDAR-EPSC amplitude following depression or potentiation induced by HFS in the presence of 1 μm LY341495. G, plot summarising changes in mean NMDAR-EPSC amplitude after HFS for cells recorded in 100 μm LY341495, EPSCs were potentiated in 4 cells (green symbols) and depressed in 6 cells (black symbols). H, bar graph summarising the changes in NMDAR-EPSC amplitude following potentiation or depression induced by HFS in the presence of 100 μm LY341495.

Similar articles

Cited by

References

    1. Aponte Y, Bischofberger J, Jonas P. Efficient Ca2+ buffering in fast-spiking basket cells of rat hippocampus. The Journal of Physiology. 2008;586:2061–2075. - PMC - PubMed
    1. Asrar S, Zhou Z, Ren W, Jia Z. Ca(2+) permeable AMPA receptor induced long-term potentiation requires PI3/MAP kinases but not Ca/CaM-dependent kinase II. PLoS One. 2009;4:e4339. - PMC - PubMed
    1. Bartos M, Vida I, Frotscher M, Meyer A, Monyer H, Geiger JR, Jonas P. Fast synaptic inhibition promotes synchronized gamma oscillations in hippocampal interneuron networks. Proc Natl Acad Sci U S A. 2002;99:13222–13227. - PMC - PubMed
    1. Bashir ZI, Alford S, Davies SN, Randall AD, Collingridge GL. Long-term potentiation of NMDA receptor-mediated synaptic transmission in the hippocampus. Nature. 1991;349:156–158. - PubMed
    1. Berretta N, Berton F, Bianchi R, Brunelli M, Capogna M, Francesconi W. Long-term potentiation of NMDA receptor-mediated EPSPs in guinea-pig hippocampal slices. Eur J Neurosci. 1991;3:850–854. - PubMed

Publication types

LinkOut - more resources