

The effects of magnetite (Fe₃O₄) nanoparticles on electroporation-induced inward currents in pituitary tumor (GH₃) cells and in RAW 264.7 macrophages
- PMID: 22615532
- PMCID: PMC3357052
- DOI: 10.2147/IJN.S28798
The effects of magnetite (Fe₃O₄) nanoparticles on electroporation-induced inward currents in pituitary tumor (GH₃) cells and in RAW 264.7 macrophages
Abstract
Aims: Fe₃O₄ nanoparticles (NPs) have been known to provide a distinct image contrast effect for magnetic resonance imaging owing to their super paramagnetic properties on local magnetic fields. However, the possible effects of these NPs on membrane ion currents that concurrently induce local magnetic field perturbation remain unclear.
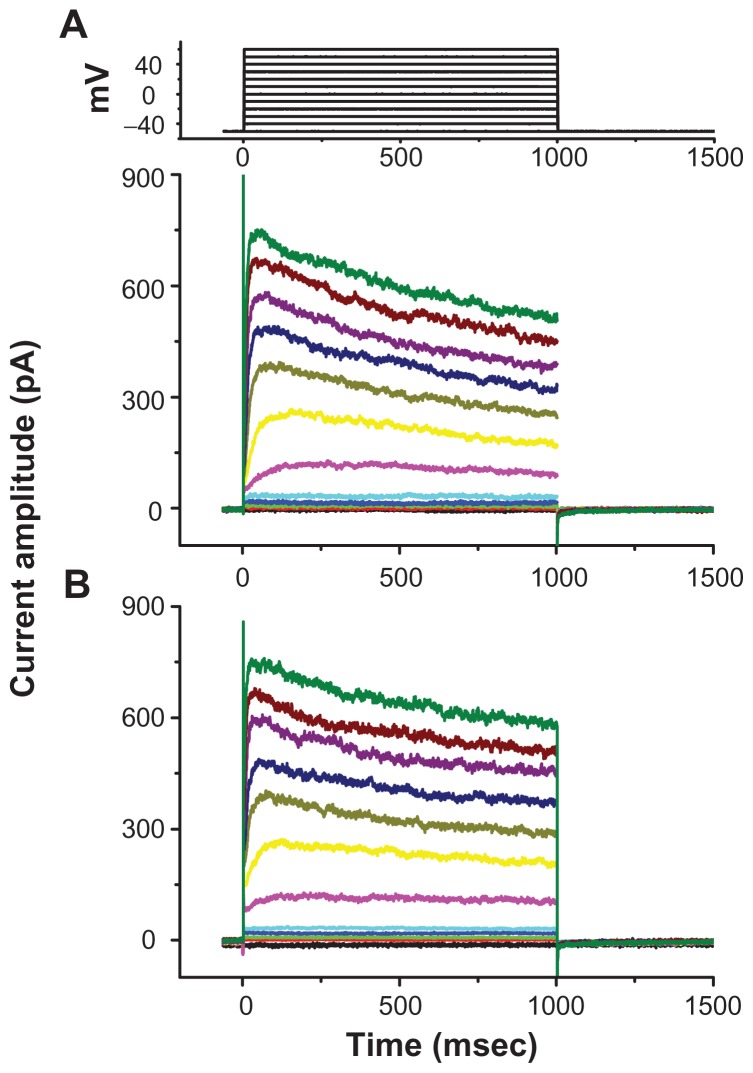
Methods: We evaluated whether amine surface-modified Fe₃O₄ NPs have any effect on ion currents in pituitary tumor (GH₃) cells via voltage clamp methods.
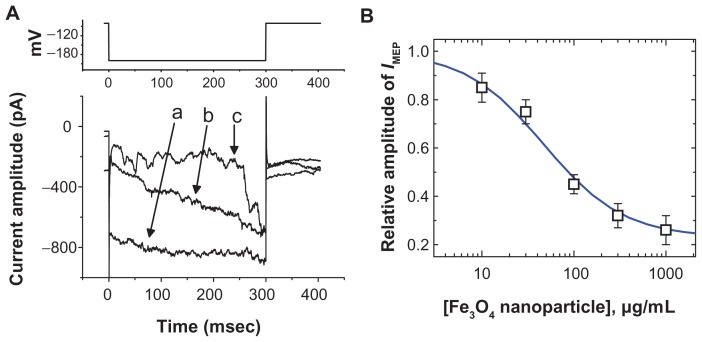
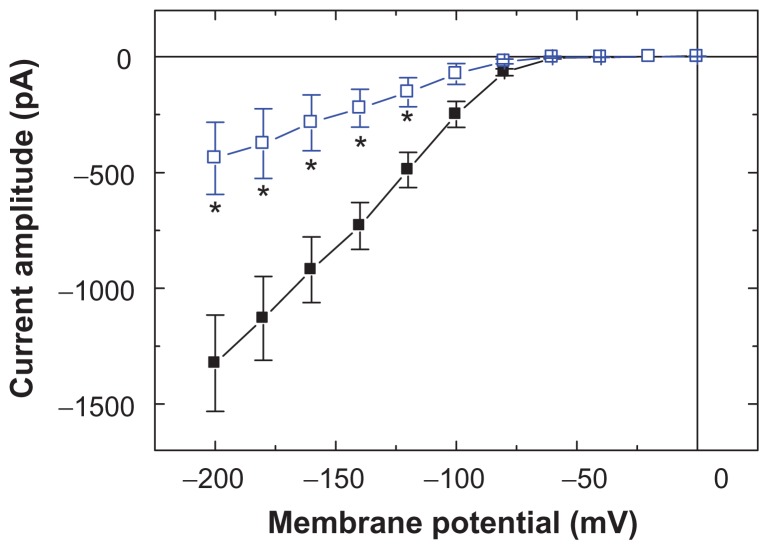
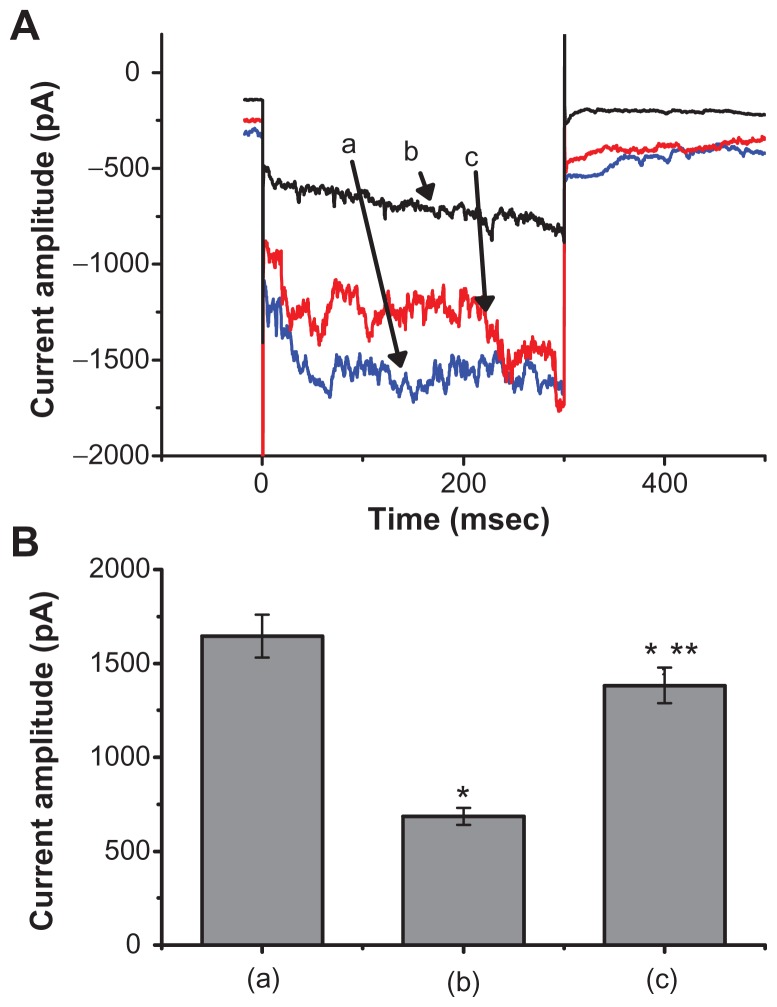
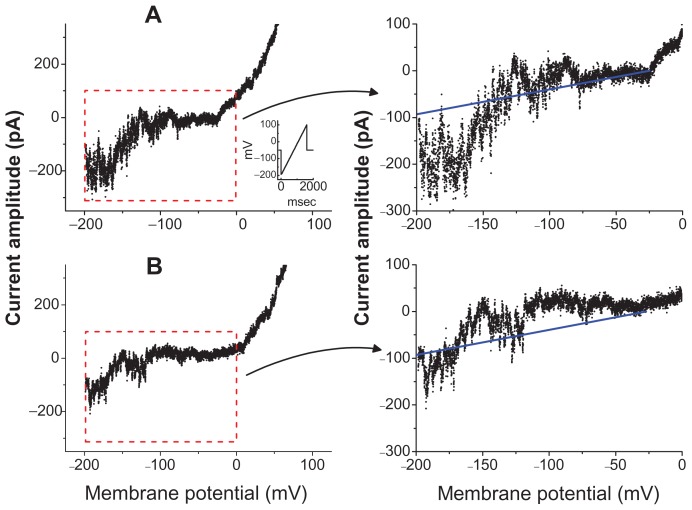
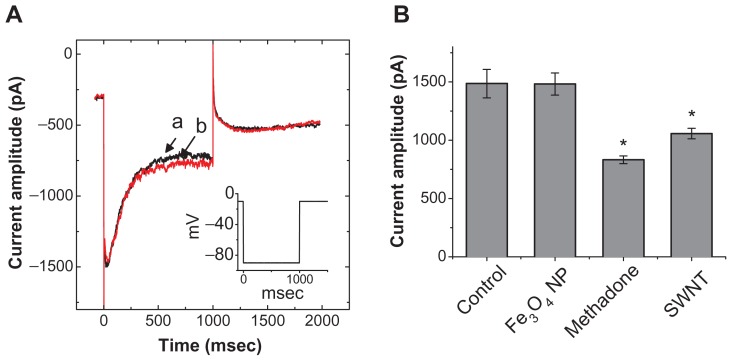
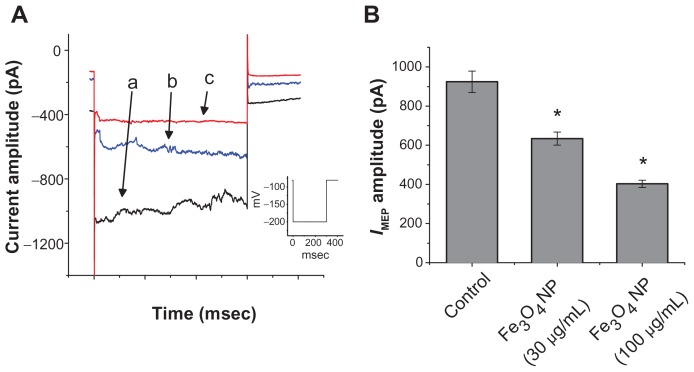
Results: The addition of Fe₃O₄ NPs decreases the amplitude of membrane electroporation-induced currents (I(MEP)) with a half-maximal inhibitory concentration at 45 μg/mL. Fe₃O₄ NPs at a concentration of 3 mg/mL produced a biphasic response in the amplitude of I(MEP), ie, an initial decrease followed by a sustained increase. A similar effect was also noted in RAW 264.7 macrophages.
Conclusion: The modulation of magnetic electroporation-induced currents by Fe₃O₄ NPs constitutes an important approach for cell tracking under various imaging modalities or facilitated drug delivery.
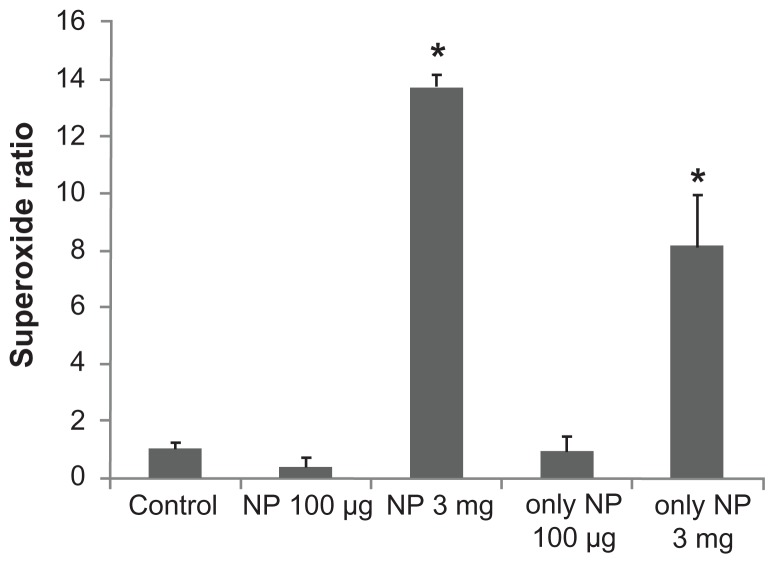
Keywords: free radical; ion current; iron oxide.
Figures
Similar articles
-
Investigations into the correlation properties of membrane electroporation-induced inward currents: prediction of pore formation.Cell Biochem Biophys. 2012 Jan;62(1):211-20. doi: 10.1007/s12013-011-9284-3. Cell Biochem Biophys. 2012. PMID: 21928108
-
Microfluidic Electroporation-Facilitated Synthesis of Erythrocyte Membrane-Coated Magnetic Nanoparticles for Enhanced Imaging-Guided Cancer Therapy.ACS Nano. 2017 Apr 25;11(4):3496-3505. doi: 10.1021/acsnano.7b00133. Epub 2017 Mar 13. ACS Nano. 2017. PMID: 28272874
-
Effects of ranolazine, a novel anti-anginal drug, on ion currents and membrane potential in pituitary tumor GH(3) cells and NG108-15 neuronal cells.J Pharmacol Sci. 2009 Jul;110(3):295-305. doi: 10.1254/jphs.09018fp. J Pharmacol Sci. 2009. PMID: 19609066
-
Cholesterol depletion with (2-hydroxypropyl)- β-cyclodextrin modifies the gating of membrane electroporation-induced inward current in pituitary tumor GH3 cells: experimental and analytical studies.Cell Physiol Biochem. 2011;28(5):959-68. doi: 10.1159/000335809. Epub 2011 Dec 15. Cell Physiol Biochem. 2011. PMID: 22178947
-
Fe3O4-based nanotheranostics for magnetic resonance imaging-synergized multifunctional cancer management.Nanomedicine (Lond). 2019 Jun;14(11):1493-1512. doi: 10.2217/nnm-2018-0346. Epub 2019 Jun 19. Nanomedicine (Lond). 2019. PMID: 31215317 Review.
Cited by
-
Evidence for the Effectiveness of Remdesivir (GS-5734), a Nucleoside-Analog Antiviral Drug in the Inhibition of I K(M) or I K(DR) and in the Stimulation of I MEP.Front Pharmacol. 2020 Jul 21;11:1091. doi: 10.3389/fphar.2020.01091. eCollection 2020. Front Pharmacol. 2020. PMID: 32792942 Free PMC article.
-
Functionalized SPION immobilized on graphene-oxide: Anticancer and antiviral study.Diam Relat Mater. 2022 Aug;127:109149. doi: 10.1016/j.diamond.2022.109149. Epub 2022 Jun 3. Diam Relat Mater. 2022. PMID: 35677893 Free PMC article.
-
Evaluation of Small-Molecule Candidates as Modulators of M-Type K+ Currents: Impacts on Current Amplitude, Gating, and Voltage-Dependent Hysteresis.Int J Mol Sci. 2025 Feb 11;26(4):1504. doi: 10.3390/ijms26041504. Int J Mol Sci. 2025. PMID: 40003973 Free PMC article. Review.
-
Chemical and magnetic functionalization of graphene oxide as a route to enhance its biocompatibility.Nanoscale Res Lett. 2014 Dec 4;9(1):656. doi: 10.1186/1556-276X-9-656. eCollection 2014. Nanoscale Res Lett. 2014. PMID: 25593549 Free PMC article.
-
Effective Perturbations on the Amplitude and Hysteresis of Erg-Mediated Potassium Current Caused by 1-Octylnonyl 8-[(2-hydroxyethyl)[6-oxo-6(undecyloxy)hexyl]amino]-octanoate (SM-102), a Cationic Lipid.Biomedicines. 2021 Oct 1;9(10):1367. doi: 10.3390/biomedicines9101367. Biomedicines. 2021. PMID: 34680484 Free PMC article.
References
-
- Oghabian MA, Gharehaghaji N, Amirmohseni S, Khoei S, Guiti M. Detection sensitivity of lymph nodes of various sizes using USPIO nanoparticles in magnetic resonance imaging. Nanomedicine. 2010;6(3):496–499. - PubMed
-
- Shieh DB, Cheng FY, Su CH, et al. Aqueous dispersions of magnetite nanoparticles with NH3+ surfaces for magnetic manipulations of biomolecules and MRI contrast agents. Biomaterials. 2005;26(34):7183–7191. - PubMed
-
- Wu PC, Su CH, Cheng FY, et al. Modularly assembled magnetite nanoparticles enhance in vivo targeting for magnetic resonance cancer imaging. Bioconjug Chem. 2008;19(10):1972–1979. - PubMed
-
- Hughes S, El Haj AJ, Dobson J. Magnetic micro- and nanoparticle mediated activation of mechanosensitive ion channels. Med Eng Phys. 2005;27(9):754–762. - PubMed
Publication types
MeSH terms
Substances
LinkOut - more resources
Full Text Sources
Medical
