. 2012;10(5):e1001328.
doi: 10.1371/journal.pbio.1001328. Epub 2012 May 15.

Mechanisms and evolutionary patterns of mammalian and avian dosage compensation

Affiliations

Mechanisms and evolutionary patterns of mammalian and avian dosage compensation

Philippe Julien et al. PLoS Biol. 2012.

Abstract

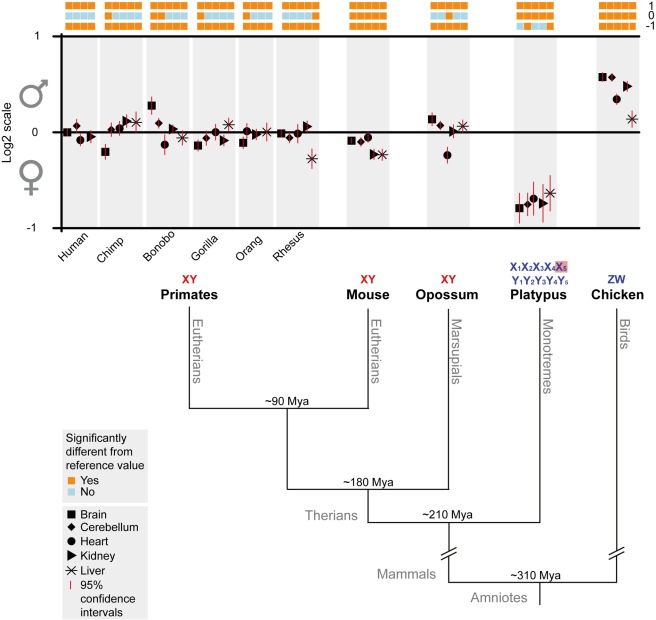
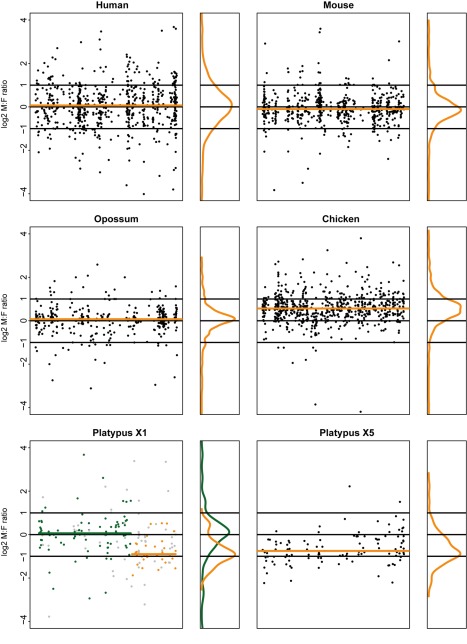
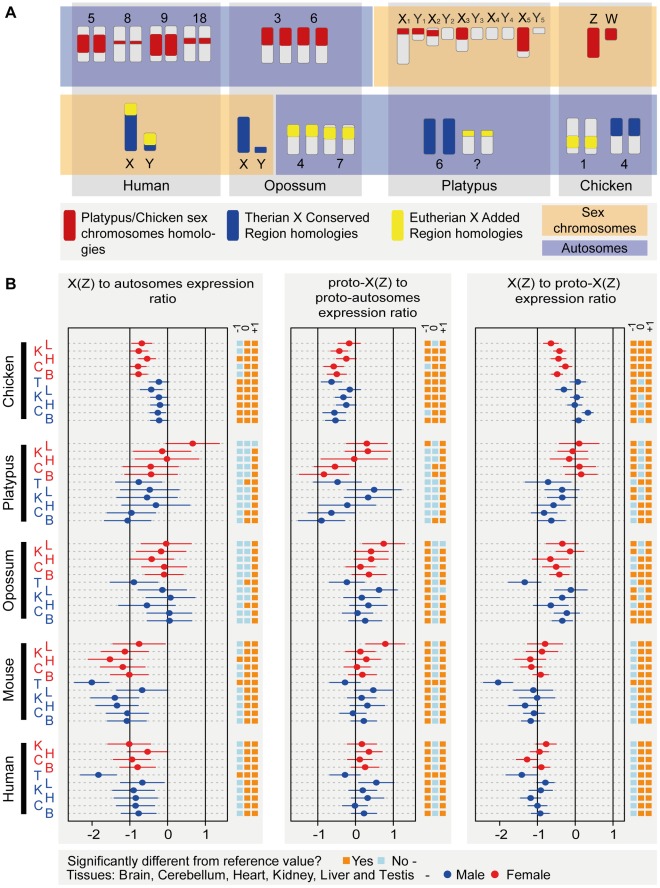
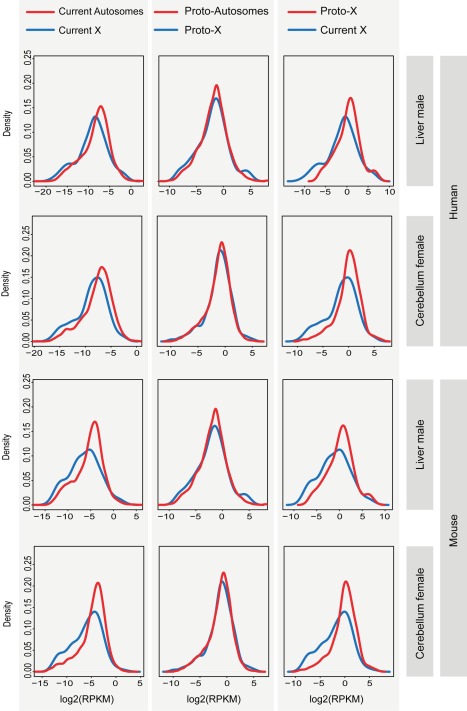
As a result of sex chromosome differentiation from ancestral autosomes, male mammalian cells only contain one X chromosome. It has long been hypothesized that X-linked gene expression levels have become doubled in males to restore the original transcriptional output, and that the resulting X overexpression in females then drove the evolution of X inactivation (XCI). However, this model has never been directly tested and patterns and mechanisms of dosage compensation across different mammals and birds generally remain little understood. Here we trace the evolution of dosage compensation using extensive transcriptome data from males and females representing all major mammalian lineages and birds. Our analyses suggest that the X has become globally upregulated in marsupials, whereas we do not detect a global upregulation of this chromosome in placental mammals. However, we find that a subset of autosomal genes interacting with X-linked genes have become downregulated in placentals upon the emergence of sex chromosomes. Thus, different driving forces may underlie the evolution of XCI and the highly efficient equilibration of X expression levels between the sexes observed for both of these lineages. In the egg-laying monotremes and birds, which have partially homologous sex chromosome systems, partial upregulation of the X (Z in birds) evolved but is largely restricted to the heterogametic sex, which provides an explanation for the partially sex-biased X (Z) expression and lack of global inactivation mechanisms in these lineages. Our findings suggest that dosage reductions imposed by sex chromosome differentiation events in amniotes were resolved in strikingly different ways.


Conflict of interest statement

The authors have declared that no competing interests exist.

Figures

Figure 1
Figure 1. Median male versus female expression levels of mammalian X-linked and avian Z-linked genes in five somatic tissues.
Top: Median male to female (M∶F) gene expression level ratios and 95% confidence intervals for five somatic tissues derived from nine mammals and one bird. M∶F ratio calculations are based on genes expressed in both sexes (RPKM>0). Values are plotted on a log2 scale to allow for linear and symmetrical patterns (e.g., same distances for two-fold higher expression levels in males or females, respectively). Statistically significant deviations of M∶F ratios from key reference values (orange/blue boxes): 0.5 (log2 ratio of −1); 1 (log2 ratio of 0); and 2 (log2 ratio of 1), as assessed by one-sample Wilcoxon signed rank tests (Bonferroni corrected p<0.05). Numbers of X (X5, Z) genes considered in the analysis are: 664 (human), 520 (chimp), 657 (gorilla), 606 (orang), 731 (macaque), 750 (mouse), 442 (opossum), 137 (platypus), 733 (chicken). Bottom: Schematic tree illustrating the phylogenetic relationships and sex chromosomes (homologous therian XY chromosomes in red; [partially] homologous platypus and bird sex chromosomes in blue) of the amniote lineages for which male and female expression was compared. Specifically, male and female expression values were compared for the therian X, platypus X5 (highlighted in pink), and chicken Z chromosome. Approximate divergence time estimates (million years ago [Mya]) are based on previous studies –. Note that the expression ratios shown for eutherians are based on protein-coding genes from the entire X chromosome, that is, the ancestral part of the eutherian X (the so-called XCR) , as well as the region that became X-linked during early eutherian evolution (termed XAR) . Expression ratios for the XCR only are shown in Figure S1.
Figure 2
Figure 2. Male versus female expression levels of individual sex chromosomal genes in cerebellum from representative amniotes.
Male to female (M∶F) gene expression ratios are plotted for individual genes (expressed in both sexes) on the human, mouse, and opossum X, platypus X1 and X5, and chicken Z chromosome for a representative tissue (cerebellum). Values are plotted on a log2 scale to allow for linear and symmetrical patterns (e.g., 0.5 [log2 ratio of −1]; 1 [log2 ratio of 0]; and 2 [log2 ratio of 1]). Median M∶F ratios for human, mouse, and opossum X, platypus X5 and X1 non-pseudoautosomal region, and chicken Z are indicated by orange lines. The distribution of individual M∶F ratios (orange vertical plots) is shown to the right of each main plot. Expression ratios of individual genes on the platypus X1 chromosome are indicated by green circles (pseudoautosomal genes with 1∶1 orthologs on chicken Chromosomes Z, 3, or 13; see for details), orange circles (non-pseudoautosomal/sex-linked genes with 1∶1 orthologs on chicken Chromosome 12 [3]), or grey circles (pseudoautosomal or non-pseudoautosomal genes without clear 1∶1 chicken orthologs). Note that the respective medians for the platypus X1 were calculated on the basis of genes with chicken 1∶1 orthologs, although the other genes in these regions show very similar patterns. See Table S3 for platypus X1 M∶F ratios for all six organs.
Figure 3
Figure 3. Sex chromosome homology relationships and current and inferred ancestral expression levels of genes on the mammalian (proto) X or avian Z chromosomes.
(A) Sex chromosomes in the different mammals and birds and their corresponding homologous autosomal counterparts in species with non-homologous sex chromosome systems. (B) Left: median X (Z) to autosome expression level ratios (and 95% confidence intervals) of expressed genes on the current sex chromosomes in five representative amniotes that have 1∶1 orthologs in all studied species (see Figure S3 for plots with all ten species). Middle: median X (Z) to autosome ratios of expressed genes on “proto-sex chromosomes,” as inferred from autosomal one-to-one orthologous genes from species with non-homologous sex chromosomes (see (A), main text, and Methods for details). Right: median current to ancestral X (Z)-linked gene expression ratios for genes expressed both on the current X and proto-X (normalized by expression levels of autosomal genes, respectively). Note that values are plotted on a log2 scale to allow for linear and symmetrical patterns. Numbers of X (X5, Z) conserved genes (i.e., genes with clear 1∶1 orthologs across the ten species) considered in these analyses are: 157 (human), 156 (chimp), 158 (gorilla), 156 (orang), 155 (macaque), 153 (mouse), 91 (opossum), 56 (platypus), 296 (chicken). See Figure S3 for similar plot containing data for all ten species. See Methods for details regarding the calculation of the different ratios. Statistically significant deviations from the reference values (0.5 [log2 ratio of −1]; 1 [log2 ratio of 0]; and 2 [log2 ratio of 1]), as assessed by one-sample Wilcoxon signed rank tests (Benjamini-Hochberg corrected p<0.05) are indicated to the right of each plot (oranges/blue boxes).
Figure 4
Figure 4. Distributions of current and inferred ancestral expression levels of genes on the eutherian (proto) X chromosomes and autosomes.
Distributions of expression levels of (proto) X-linked genes (blue line) and (proto) autosomal genes (red line) are shown for cerebellum and liver from human and mouse. Expression levels in the comparison of the current X and proto-X (right plots) are normalized by the respective autosomal expression levels. Gene expression level distributions for the X are significantly shifted towards lower values compared to those for autosomes (Benjamini-Hochberg p<0.05; corrected Komolgorov-Smirnov test). Also, gene expression level distributions for the current X are significantly shifted towards lower values compared to those for the proto-X (Benjamini-Hochberg p<0.05; corrected Komolgorov-Smirnov test). The distributions for the proto-X and proto-autosomes are not significantly different from each other (Benjamini-Hochberg p>0.05; corrected Komolgorov-Smirnov test). See Table S1 for all tests of differences between X and autosomal expression distributions (all tissues from all species).
Figure 5
Figure 5. Distributions of tissue-specific genes in the human genome and testis-specific genes therian genomes.
(A) Proportions of tissue-specific genes on the human X chromosome and autosomes, respectively: br, brain; cb, cerebellum; ht, heart; kd, kidney; lv, liver; non, no tissue-specificity; and ts, testis. Statistically significant differences as assessed by Fisher exact test are indicated: *two-tailed p<0.05; *two-tailed p<0.01. (B) Density plots of testis-specificity index for genes on the human X chromosome and autosomes. (C) Proportions of testis-specific genes on therian X chromosomes and autosomes, for all expressed genes (ALL), “recent” genes ([REC], i.e., all genes except 1∶1 orthologs present on both the current chromosomes and ancestral/proto chromosomes), and “old” genes ([OLD], i.e., 1∶1 orthologs present on both the current chromosomes and ancestral/proto chromosomes). Species: hsa, human (Homo sapiens); ptr, chimpanzee (Pan troglodytes); ppa, bonobo (Pan paniscus); ggo, gorilla (Gorilla gorilla); mml, macaque (Macaca mulatta); mmu, mouse (Mus musculus); mdo, opossum (M. domestica).
Figure 6
Figure 6. Distributions of current and inferred ancestral expression levels of genes on the marsupial (proto) X chromosomes and autosomes.
Distributions of expression levels of (proto) X-linked genes (blue line) and (proto) autosomal genes (red line) are shown for cerebellum and liver from opossum. Expression levels in the comparison of the current X and proto-X (right plots) are normalized by the respective autosomal expression levels. In all cases, the two plotted distributions are not significantly different from each other (Benjamini-Hochberg corrected p>0.05; Komolgorov-Smirnov test). See Table S1 for all tests of differences between X and autosomal expression distributions (all tissues).
Figure 7
Figure 7. Expression levels of therian genes in the X-conserved region and their autosomal counterparts in platypus and chicken.
Left: Global expression levels (based on third quartiles of the RPKM distribution) of genes in the therian XCR (see Figure 3B legend for details) and their autosomal orthologs in outgroup species with different sex chromosome systems (see Figure S10 for all five somatic tissues). Error bars represent the range containing 90% of the third quartiles of individual resampling sets (80% of 90 orthologous genes were resampled 100 times). Right: Expression levels of resampled sets of 90 genes that are autosomal in all ten species. The central value is the median of the third quartiles of resampled sets (error bars represent the central 90% of the distribution of those third quartiles).
Figure 8
Figure 8. Distributions of current and inferred ancestral expression levels of genes on the platypus (proto) X chromosomes/autosomes and chicken (proto) Z chromosome/autosomes.
Distributions of expression levels of (proto) sex chromosome-linked genes (blue line) and (proto) autosomal genes (red line) are shown for cerebellum from platypus and chicken. Expression levels in the comparison of the current X (Z) and proto-X (Z) are normalized by the respective autosomal expression levels (rightmost plots). See Table S1 for all tests of differences between X (Z) and autosomal expression distributions (all tissues).
Figure 9
Figure 9. Concerted downregulation of X-linked and autosomal genes in the brain of placental and marsupial (i.e., therian) mammals.
Modules with specific expression states in the therian brain (module 563; 330 genes) or eutherian brain/cerebellum (module 634; 313 genes) are shown. Bars represent the weighted average expression of all genes in a module, for each sample (horizontal grey line, average bar height). The horizontal red line represents the cutoff of the biclustering algorithm; samples above the red line are considered to have a distinct expression state. Note that the modules shown are highly enriched for X-linked genes (module 563: 25 observed versus 8.5 expected, p<10−3; module 634: 28 observed versus 8.3 expected, p<10−4), as are modules 421, 507, 521, and 618, which display transcriptional downregulations in therians or eutherians and were all considered in the protein–protein interaction analyses (see main text and Methods). All modules can be explored in a searchable database: http://www.unil.ch/cbg/ISA/species.

References

    1. Ohno S. Sex chromosomes and sex-linked genes. Berlin: Springer-Verlag; 1967.
    1. Potrzebowski L, Vinckenbosch N, Marques A. C, Chalmel F, Jegou B, et al. Chromosomal gene movements reflect the recent origin and biology of therian sex chromosomes. PLoS Biol. 2008;6:e80. doi: 10.1371/journal.pbio.0060080. - DOI - PMC - PubMed
    1. Veyrunes F, Waters P. D, Miethke P, Rens W, McMillan D, et al. Bird-like sex chromosomes of platypus imply recent origin of mammal sex chromosomes. Genome Res. 2008;18:965–973. - PMC - PubMed
    1. Grutzner F, Rens W, Tsend-Ayush E, El-Mogharbel N, O'Brien P. C, et al. In the platypus a meiotic chain of ten sex chromosomes shares genes with the bird Z and mammal X chromosomes. Nature. 2004;432:913–917. - PubMed
    1. Charlesworth B, Charlesworth D. The degeneration of Y chromosomes. Philos Trans R Soc Lond B Biol Sci. 2000;355:1563–1572. - PMC - PubMed

Publication types