

Insights into the fold organization of TIM barrel from interaction energy based structure networks
- PMID: 22615547
- PMCID: PMC3355060
- DOI: 10.1371/journal.pcbi.1002505
Insights into the fold organization of TIM barrel from interaction energy based structure networks
Abstract
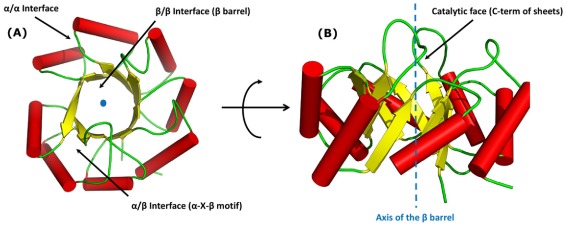
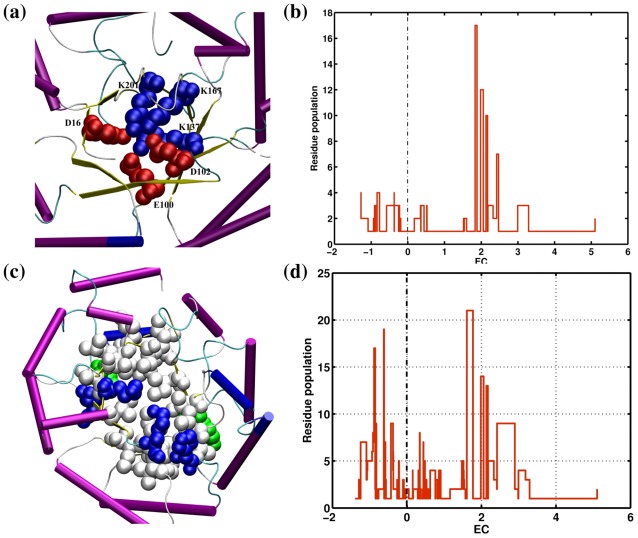
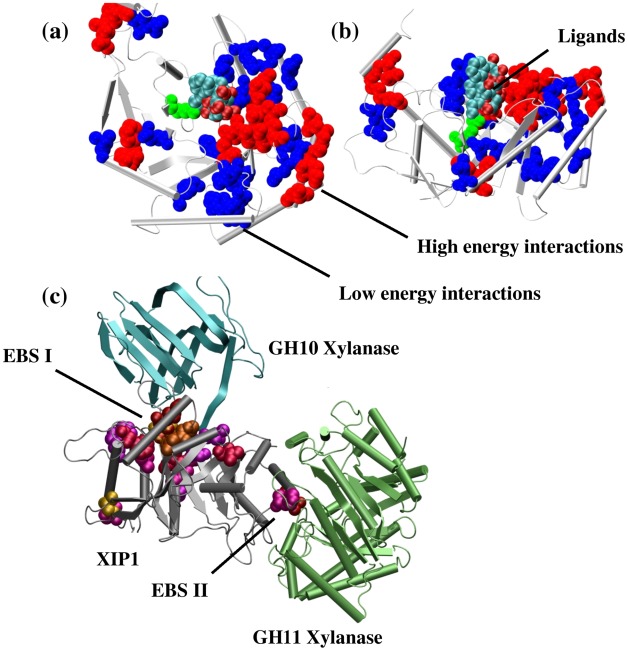
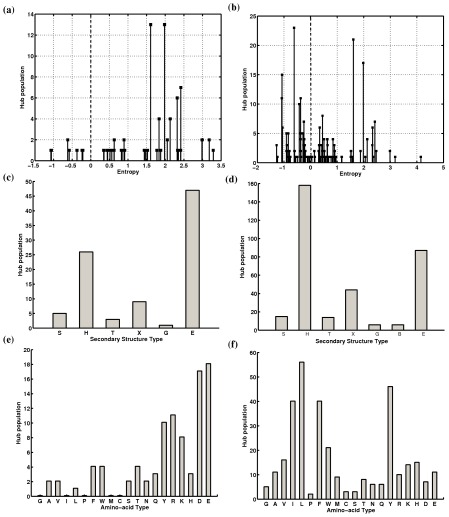
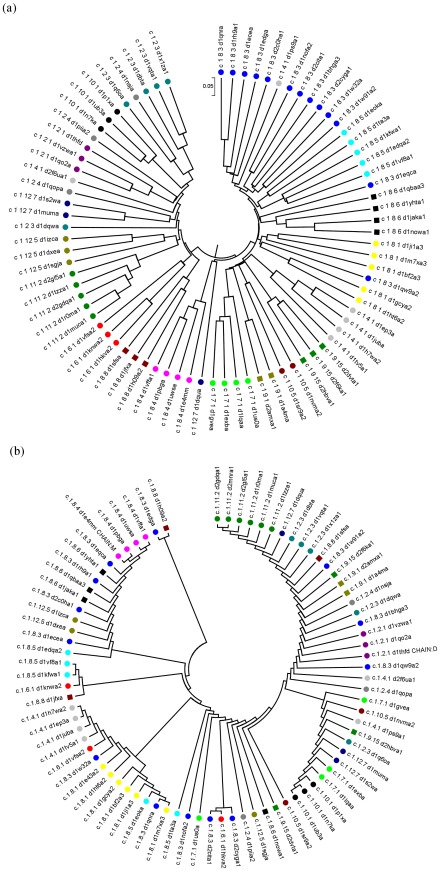
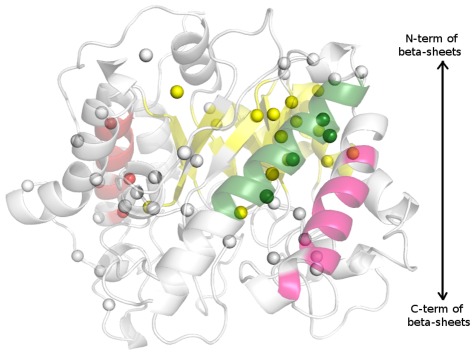
There are many well-known examples of proteins with low sequence similarity, adopting the same structural fold. This aspect of sequence-structure relationship has been extensively studied both experimentally and theoretically, however with limited success. Most of the studies consider remote homology or "sequence conservation" as the basis for their understanding. Recently "interaction energy" based network formalism (Protein Energy Networks (PENs)) was developed to understand the determinants of protein structures. In this paper we have used these PENs to investigate the common non-covalent interactions and their collective features which stabilize the TIM barrel fold. We have also developed a method of aligning PENs in order to understand the spatial conservation of interactions in the fold. We have identified key common interactions responsible for the conservation of the TIM fold, despite high sequence dissimilarity. For instance, the central beta barrel of the TIM fold is stabilized by long-range high energy electrostatic interactions and low-energy contiguous vdW interactions in certain families. The other interfaces like the helix-sheet or the helix-helix seem to be devoid of any high energy conserved interactions. Conserved interactions in the loop regions around the catalytic site of the TIM fold have also been identified, pointing out their significance in both structural and functional evolution. Based on these investigations, we have developed a novel network based phylogenetic analysis for remote homologues, which can perform better than sequence based phylogeny. Such an analysis is more meaningful from both structural and functional evolutionary perspective. We believe that the information obtained through the "interaction conservation" viewpoint and the subsequently developed method of structure network alignment, can shed new light in the fields of fold organization and de novo computational protein design.
Conflict of interest statement
The authors have declared that no competing interests exist.
Figures

Similar articles
-
Similarity in Shape Dictates Signature Intrinsic Dynamics Despite No Functional Conservation in TIM Barrel Enzymes.PLoS Comput Biol. 2016 Mar 25;12(3):e1004834. doi: 10.1371/journal.pcbi.1004834. eCollection 2016 Mar. PLoS Comput Biol. 2016. PMID: 27015412 Free PMC article.
-
TIM-Finder: a new method for identifying TIM-barrel proteins.BMC Struct Biol. 2009 Dec 14;9:73. doi: 10.1186/1472-6807-9-73. BMC Struct Biol. 2009. PMID: 20003393 Free PMC article.
-
Recurrent alpha beta loop structures in TIM barrel motifs show a distinct pattern of conserved structural features.Proteins. 1992 Apr;12(4):299-313. doi: 10.1002/prot.340120402. Proteins. 1992. PMID: 1374562
-
The TIM-barrel fold: a versatile framework for efficient enzymes.FEBS Lett. 2001 Mar 16;492(3):193-8. doi: 10.1016/s0014-5793(01)02236-0. FEBS Lett. 2001. PMID: 11257493 Review.
-
One fold with many functions: the evolutionary relationships between TIM barrel families based on their sequences, structures and functions.J Mol Biol. 2002 Aug 30;321(5):741-65. doi: 10.1016/s0022-2836(02)00649-6. J Mol Biol. 2002. PMID: 12206759 Review.
Cited by
-
Correlation of fitness landscapes from three orthologous TIM barrels originates from sequence and structure constraints.Nat Commun. 2017 Mar 6;8:14614. doi: 10.1038/ncomms14614. Nat Commun. 2017. PMID: 28262665 Free PMC article.
-
Structural, biophysical, and biochemical insights into C-S bond cleavage by dimethylsulfone monooxygenase.Proc Natl Acad Sci U S A. 2024 Nov 19;121(47):e2401858121. doi: 10.1073/pnas.2401858121. Epub 2024 Nov 12. Proc Natl Acad Sci U S A. 2024. PMID: 39531498 Free PMC article.
-
Design of symmetric TIM barrel proteins from first principles.BMC Biochem. 2015 Aug 12;16:18. doi: 10.1186/s12858-015-0047-4. BMC Biochem. 2015. PMID: 26264284 Free PMC article.
-
Nematicidal activity and action mode of a methyl-accepting chemotaxis protein from Pseudomonas syringae against Caenorhabditis elegans.Heliyon. 2024 Apr 25;10(9):e30366. doi: 10.1016/j.heliyon.2024.e30366. eCollection 2024 May 15. Heliyon. 2024. PMID: 38707475 Free PMC article.
-
Diversifying de novo TIM barrels by hallucination.Protein Sci. 2024 Jun;33(6):e5001. doi: 10.1002/pro.5001. Protein Sci. 2024. PMID: 38723111 Free PMC article.
References
-
- Anfinsen CB. Principles that govern the folding of protein chains. Science. 1973;181:223–230. - PubMed
-
- Orengo CA, Jones DT, Thornton JM. Protein superfamilies and domain superfolds. Nature. 1994;372:631–634. - PubMed
-
- Finkelstein AV, Ptitsyn OB. Why do globular proteins fit the limited set of folding patterns? Prog Biophys Mol Biol. 1987;50:171–190. - PubMed
-
- Chothia C. Proteins. One thousand families for the molecular biologist. Nature. 1992;357:543–544. - PubMed
Publication types
MeSH terms
Substances
LinkOut - more resources
Full Text Sources
