. 2012;8(5):e1002517.
doi: 10.1371/journal.pcbi.1002517. Epub 2012 May 17.

Proteome sampling by the HLA class I antigen processing pathway

Affiliations

Proteome sampling by the HLA class I antigen processing pathway

Ilka Hoof et al. PLoS Comput Biol. 2012.

Abstract

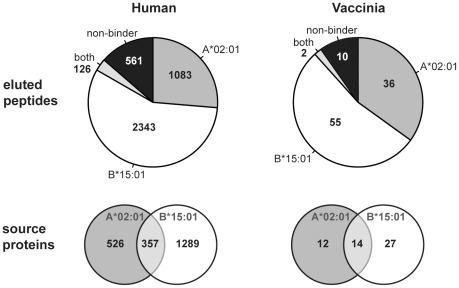
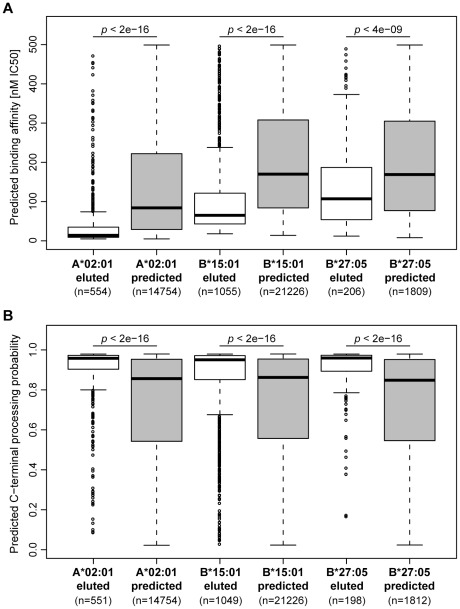
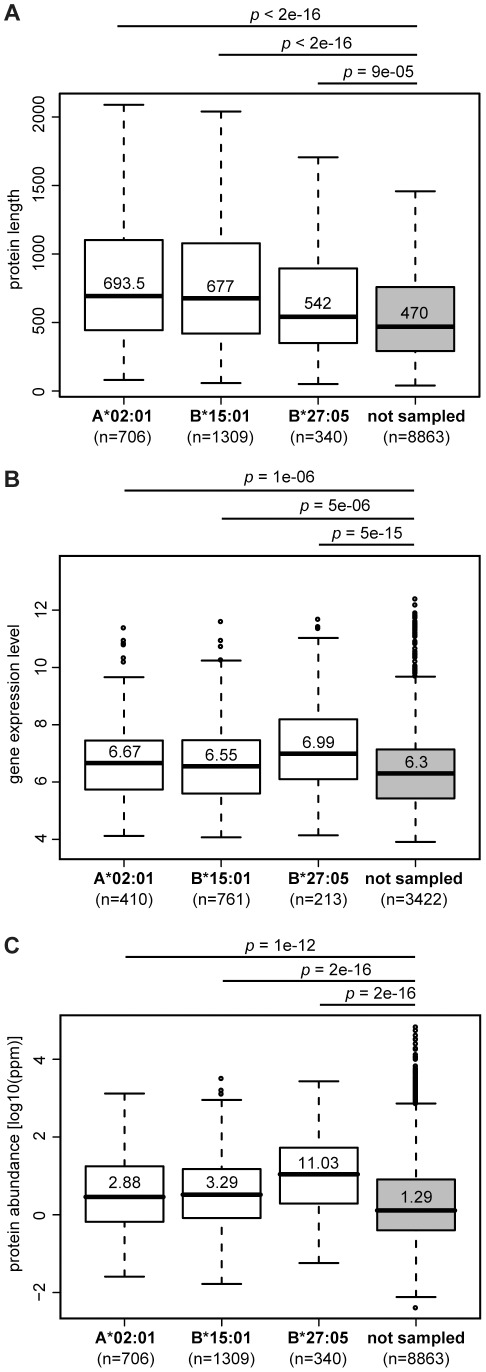
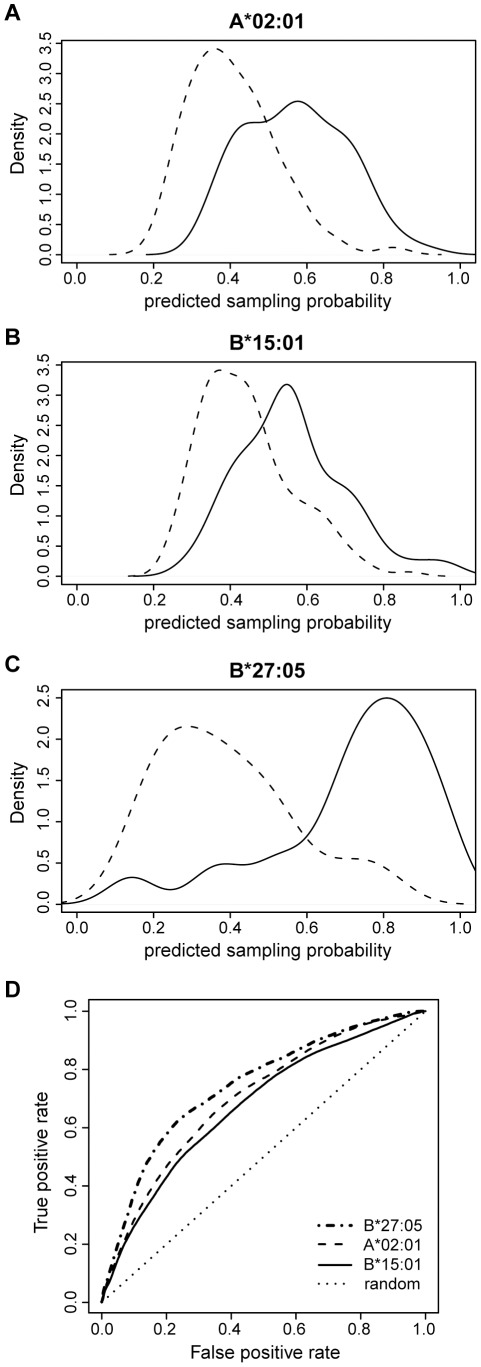
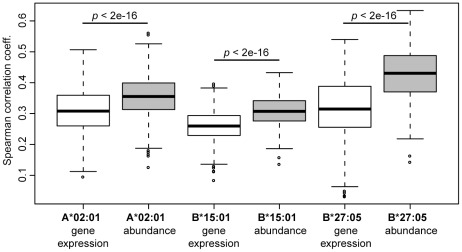
The peptide repertoire that is presented by the set of HLA class I molecules of an individual is formed by the different players of the antigen processing pathway and the stringent binding environment of the HLA class I molecules. Peptide elution studies have shown that only a subset of the human proteome is sampled by the antigen processing machinery and represented on the cell surface. In our study, we quantified the role of each factor relevant in shaping the HLA class I peptide repertoire by combining peptide elution data, in silico predictions of antigen processing and presentation, and data on gene expression and protein abundance. Our results indicate that gene expression level, protein abundance, and rate of potential binding peptides per protein have a clear impact on sampling probability. Furthermore, once a protein is available for the antigen processing machinery in sufficient amounts, C-terminal processing efficiency and binding affinity to the HLA class I molecule determine the identity of the presented peptides. Having studied the impact of each of these factors separately, we subsequently combined all factors in a logistic regression model in order to quantify their relative impact. This model demonstrated the superiority of protein abundance over gene expression level in predicting sampling probability. Being able to discriminate between sampled and non-sampled proteins to a significant degree, our approach can potentially be used to predict the sampling probability of self proteins and of pathogen-derived proteins, which is of importance for the identification of autoimmune antigens and vaccination targets.


Conflict of interest statement

The authors have declared that no competing interests exist.

Figures

Figure 1
Figure 1. Composition of the Johnson data.
The pie charts depict the fractions of eluted peptides that were predicted to bind to HLA-A*02:01, B*15:01, both, or neither of the two alleles. Predictions were only performed for peptides of 8–13 amino acids in length (n = 4113 for human-derived peptides, n = 103 for vaccinia). The Venn diagrams indicate the number of source proteins these peptides originated from.
Figure 2
Figure 2. Eluted peptides show higher binding affinity to HLA and more efficient C-terminal processing.
The boxplots compare eluted 9mer peptides and predicted binders from the same set of source proteins in terms of (A) predicted binding affinity to A*02:01, B*15:01, and B*27:05, respectively, and (B) predicted C-terminal processing probability. For the matter of correctness, we removed eluted peptides from the data set that had also been part of the NetChop training set (n = 15).
Figure 3
Figure 3. Protein length, gene expression level, and protein abundance impact protein sampling probability.
The boxplots compare sampled and non-sampled human proteins in terms of (A) protein length, (B) gene expression level, and (C) protein abundance. The difference in protein counts between plots is due to lack of (gene expression or protein abundance) data for some of the proteins.
Figure 4
Figure 4. The regression model is able to distinguish sampled from non-sampled proteins.
(AC) Predicted sampling probability for A*02:01, B*15:01, and B*27:05 (best examples of 100 cross-validation runs per allele; solid line: sampled proteins; dashed line: non-sampled proteins). The sampling probability is calculated as f(z) = ez/(ez+1) where z = c+c ab log10(ab)+c pl pl+c hr hr with ab the protein abundance, pl the protein length, hr the predicted hit rate, and (A) c = −1.47, c ab = 0.49, c pl = 0.0009, c hr = 17.7, p-value = 5e-15, (B) c = −1.42, c ab = 0.46, c pl = 0.001, c hr = 16.5, p-value = 1e-14, and (C) c = −1.77, c ab = 1.15, c pl = 0.0005, c hr = 47.4, p-value = 1e-10. (D) Receiver operating characteristic (ROC) curve for A*02:01 (dashed), B*15:01 (solid), and B*27:05 (dash-dot) visualizing the performance of each of the regression models as a mean over 100 runs. The dotted line represents the ROC curve for random classification. Corresponding area under the curve (AUC): 0.70 for A*02:01, 0.68 for B*15:01, and 0.74 for B*27:05.
Figure 5
Figure 5. Protein abundance carries more information for the prediction of sampling probability than gene expression level.
Boxplots of the Spearman correlation coefficients resulting from one hundred 5× cross-validation runs for regression models that either include gene expression data or protein abundance data.

References

    1. Starr TK, Jameson SC, Hogquist KA. Positive and negative selection of T cells. Annu Rev Immunol. 2003;21:139–176. - PubMed
    1. Huseby ES, White J, Crawford F, Vass T, Becker D, et al. How the T cell repertoire becomes peptide and MHC specific. Cell. 2005;122:247–260. - PubMed
    1. Takada K, Jameson SC. Self-class I MHC molecules support survival of naive CD8 T cells, but depress their functional sensitivity through regulation of CD8 expression levels. J Exp Med. 2009;206:2253–2269. - PMC - PubMed
    1. Marrack P, Kappler J. Control of T cell viability. Annu Rev Immunol. 2004;22:765–787. - PubMed
    1. Vilches C, Parham P. KIR: diverse, rapidly evolving receptors of innate and adaptive immunity. Annu Rev Immunol. 2002;20:217–251. - PubMed

Publication types