. 2012;8(5):e1002518.
doi: 10.1371/journal.pcbi.1002518. Epub 2012 May 17.

Reconstruction of genome-scale active metabolic networks for 69 human cell types and 16 cancer types using INIT

Affiliations

Reconstruction of genome-scale active metabolic networks for 69 human cell types and 16 cancer types using INIT

Rasmus Agren et al. PLoS Comput Biol. 2012.

Abstract

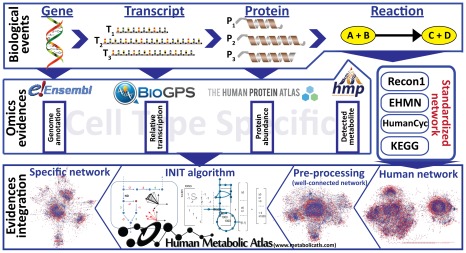
Development of high throughput analytical methods has given physicians the potential access to extensive and patient-specific data sets, such as gene sequences, gene expression profiles or metabolite footprints. This opens for a new approach in health care, which is both personalized and based on system-level analysis. Genome-scale metabolic networks provide a mechanistic description of the relationships between different genes, which is valuable for the analysis and interpretation of large experimental data-sets. Here we describe the generation of genome-scale active metabolic networks for 69 different cell types and 16 cancer types using the INIT (Integrative Network Inference for Tissues) algorithm. The INIT algorithm uses cell type specific information about protein abundances contained in the Human Proteome Atlas as the main source of evidence. The generated models constitute the first step towards establishing a Human Metabolic Atlas, which will be a comprehensive description (accessible online) of the metabolism of different human cell types, and will allow for tissue-level and organism-level simulations in order to achieve a better understanding of complex diseases. A comparative analysis between the active metabolic networks of cancer types and healthy cell types allowed for identification of cancer-specific metabolic features that constitute generic potential drug targets for cancer treatment.


Conflict of interest statement

The authors have declared that no competing interests exist.

Figures

Figure 1
Figure 1. General pipeline used in the reconstruction of cell specific genome-scale metabolic networks.
Biological information at the genome, transcriptome, proteome and metabolome levels contained in publicly available databases and generic human GEMs (Recon1, EHMN, HumanCyc) is integrated to form a generic human metabolic network, which is processed in order to obtain the connected iHuman1512 network. Subsequently, the cell type specific evidence is used to generate cell type specific subnetworks using the INIT algorithm.
Figure 2
Figure 2. Illustration of the principles of the INIT algorithm.
The hierarchical structure of GEMs is characterized by its gene-transcript-protein-reaction (GTPR) associations. In GEMs, each metabolic reaction is associated to one or more enzymes, which in turn are associated to transcripts and genes. Depending on the evidence for presence/absence of a given enzyme/gene in a cell type, a score can be calculated for the reaction(s) catalyzed by that enzyme. The HPA evidence scores are illustrated as red, light, medium and dark green representing negative, weak, moderate and strong evidence, respectively. The transcriptome evidence scores (GeneX), which are illustrated as red, light, medium, and dark blue representing low, medium and high expression, respectively. No evidence is present as white object. For some metabolites (yellow filled circle), metabolomic data are available to prove that they are present in the considered cell type. The aim of the algorithm is to find a sub-network in which the involved genes/proteins have strong evidence supporting their presence in the cell type under consideration. This is done by maximizing the sum of evidence scores. All the included reactions should be able to carry a flux and all the metabolites observed experimentally should be synthesized from precursors that the cell is known to take up. The bold lines represent the resulting network after optimization.
Figure 3
Figure 3. Gene content comparison between our hepatocyte model and HepatoNet1.
The Venn diagram shows the overlap in terms of included genes between three models. The blue, green and red squares represent iHuman1512, our hepatocyte model iHepatocyte1154 and HepatoNet1, respectively. The distribution of evidence scores of each section of the Venn diagram is plotted. The HPA evidence scores are illustrated as red, light, medium and dark green represent negative, weak moderate and strong expression, respectively. The transcriptome evidence scores (GeneX) are illustrated as red, light, medium and dark blue representing low, medium and high expression, respectively. No evidence (NE) is illustrated as grey color.
Figure 4
Figure 4. Example of a metabolic sub-network that was identified as being significantly more present in cancer tissues compared to their corresponding healthy tissues.
Aminoacetone, which is a toxic by-product of amino acid catabolism, is converted to toxic methylglyoxal in a reaction that also result in hydrogen peroxide. The toxicity of methylglyoxal is relieved by two reaction steps involving ligation to glutathione and resulting in lactic acid. The generated hydrogen peroxide is taken care of by the enzyme biliverdin reductase. This is an example of how network-based analysis can lead to a more mechanistic interpretation of data.

References

    1. Caveney E, Caveney BJ, Somaratne R, Turner JR, Gourgiotis L. Pharmaceutical interventions for obesity: a public health perspective. Diabetes Obes Metab. 2011;13:490–497. - PubMed
    1. Rokholm B, Baker JL, Sorensen TI. The levelling off of the obesity epidemic since the year 1999–a review of evidence and perspectives. Obes Rev. 2010;11:835–846. - PubMed
    1. Nielsen J. Systems biology of lipid metabolism: from yeast to human. FEBS Lett. 2009;583:3905–3913. - PubMed
    1. Thiele I, Palsson BO. A protocol for generating a high-quality genome-scale metabolic reconstruction. Nat Protoc. 2010;5:93–121. - PMC - PubMed
    1. Feist AM, Palsson BO. The growing scope of applications of genome-scale metabolic reconstructions using Escherichia coli. Nat Biotechnol. 2008;26:659–667. - PMC - PubMed

Publication types