. 2012;8(5):e1002715.
doi: 10.1371/journal.ppat.1002715. Epub 2012 May 17.

Gammaherpesvirus latency accentuates EAE pathogenesis: relevance to Epstein-Barr virus and multiple sclerosis

Affiliations

Gammaherpesvirus latency accentuates EAE pathogenesis: relevance to Epstein-Barr virus and multiple sclerosis

Costanza Casiraghi et al. PLoS Pathog. 2012.

Abstract

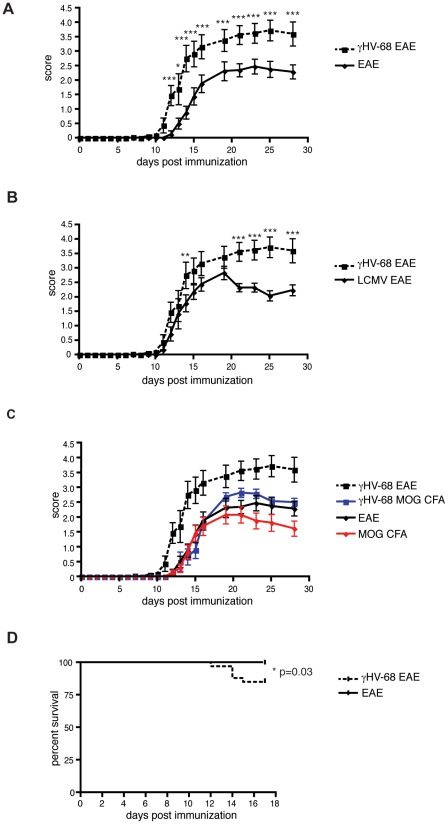
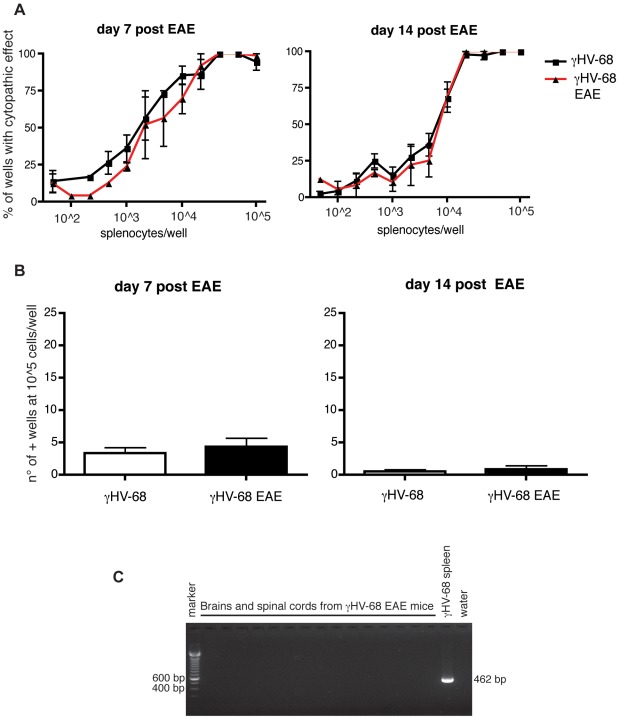
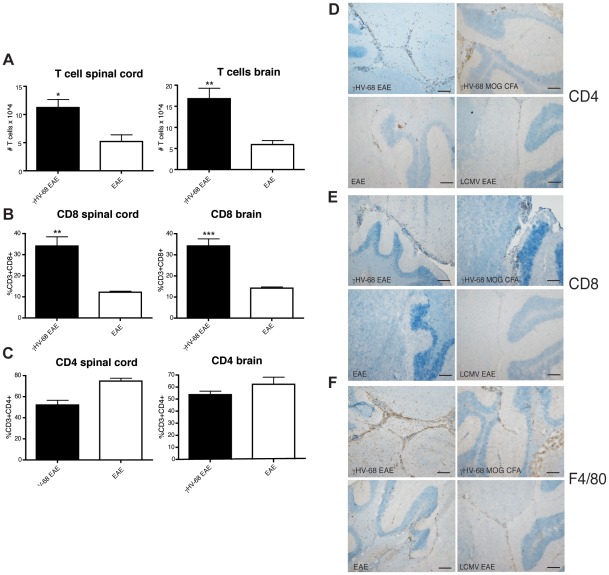
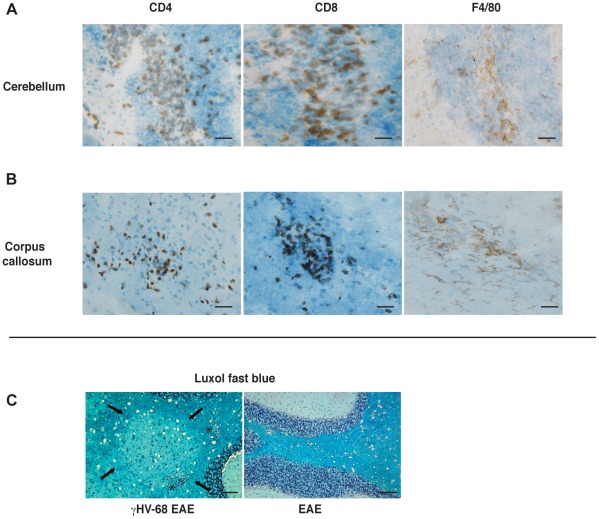
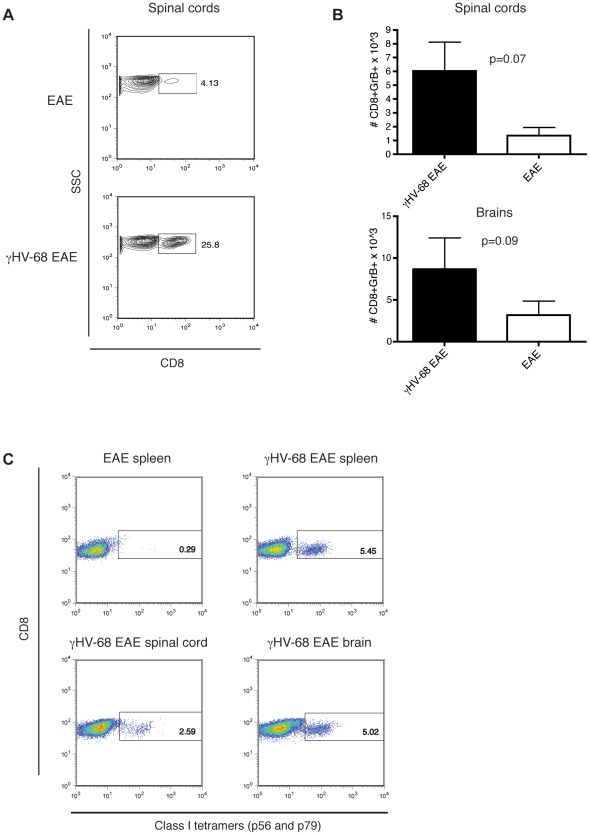
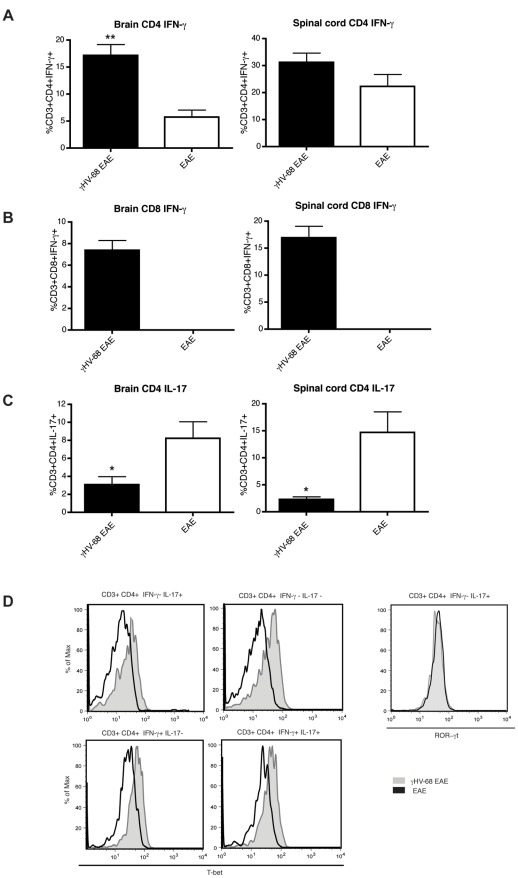
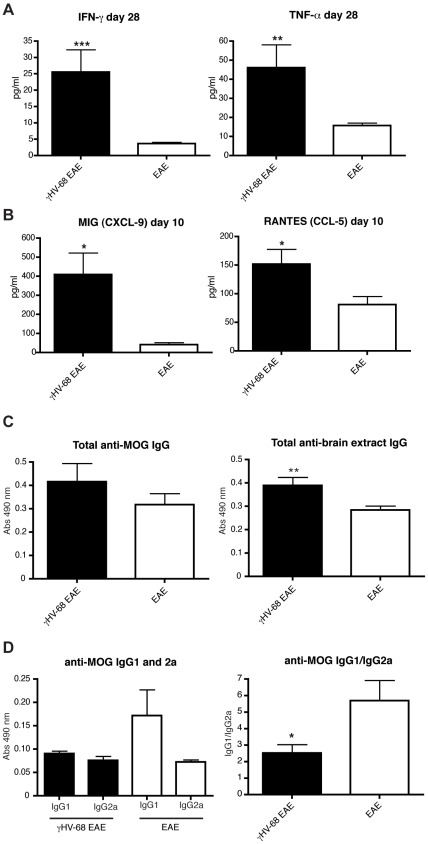
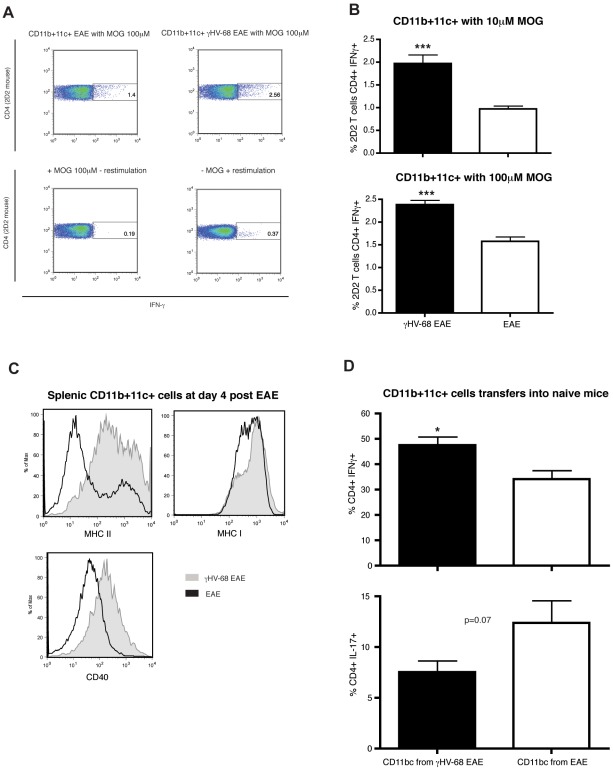
Epstein-Barr virus (EBV) has been identified as a putative environmental trigger of multiple sclerosis (MS), yet EBV's role in MS remains elusive. We utilized murine gamma herpesvirus 68 (γHV-68), the murine homolog to EBV, to examine how infection by a virus like EBV could enhance CNS autoimmunity. Mice latently infected with γHV-68 developed more severe EAE including heightened paralysis and mortality. Similar to MS, γHV-68EAE mice developed lesions composed of CD4 and CD8 T cells, macrophages and loss of myelin in the brain and spinal cord. Further, T cells from the CNS of γHV-68 EAE mice were primarily Th1, producing heightened levels of IFN-γ and T-bet accompanied by IL-17 suppression, whereas a Th17 response was observed in uninfected EAE mice. Clearly, γHV-68 latency polarizes the adaptive immune response, directs a heightened CNS pathology following EAE induction reminiscent of human MS and portrays a novel mechanism by which EBV likely influences MS and other autoimmune diseases.


Conflict of interest statement

The authors have declared that no competing interests exist.

Figures

Figure 1
Figure 1. γHV-68 infected mice show worse EAE symptoms and increased mortality.
Mice were infected with γHV-68 (dashed line) or LCMV or MEM only (solid lines). Five weeks p.i. EAE was induced (day 0 on the graph) with (EAE) or without (MOG CFA) pertussis toxin. (A-B-C) EAE scores up to day 28 post EAE induction (three separate experiments, n = 16/group). Data are shown as mean score. Data analyzed with two-way ANOVA followed by Bonferroni's post test; *** p<0.001; ** p<0.01 * p<0.05. (D) Survival up to day 18 post EAE induction (four-five separate experiments, n = 28/group). Data analyzed with Kaplan-Meier analysis.
Figure 2
Figure 2. γHV-68 does not reactivate more upon EAE induction and does not infect the CNS.
Mice were infected with γHV-68. Five weeks p.i., EAE was induced (red line with triangles, black bar) or not induced (black line with squares, open bar). At day 7 (left panel) and day 14 (right panel) post EAE induction, spleens were harvested and a limiting dilution assay was performed using (A) live splenocytes to assess the amount of ex-vivo viral reactivation and (B) lysed splenocytes to assess the amount of pre-formed virus (three separate experiments using 3–4 mice/group) (C) Brain and spinal cords were harvested from perfused γHV-68 EAE mice at different timepoints pre and post EAE (day 0 before EAE induction; day 3; day 7 and day 14 post EAE). DNA was extracted and a nested PCR was performed to detect γHV-68 DNA. A spleen was used as a positive control. Figure C shows a representative gel of three separate experiments (15 brains/spinal cords harvested at day 14 post EAE induction have been loaded on the gel displayed here; 37 brains and 39 spinal cords were analyzed in total).
Figure 3
Figure 3. γHV-68 EAE mice show increased amount of CD8 T cells infiltrations in the CNS and inflammation inside the brain parenchyma.
Mice were infected with γHV-68 (black bars) or MEM only (open bars). Five weeks p.i. EAE was induced. (A-B-C) At day 14–16 post EAE induction (mean clinical score of 3 for γHV-68 EAE mice, EAE mice were harvested at the same time), mice were perfused, brains (right panels) and spinal cords (left panels) were harvested and processed to isolate immune infiltrates. (A) Total number of infiltrating T cells (CD45+ CD11b−). (B) Percentage of infiltrating CD3+ CD8+ lymphocytes and (C) CD3+ CD4+ lymphocytes. Three separate experiments with 8–6 mice/group; data were analyzed with t-test: *** p<0.001; ** p<0.01, * p<0.05. (D-E-F) Mice were infected with γHV-68 (upper panels left and right: γHV-68 EAE and γHV-68 MOG CFA); or LCMV (bottom right panel: LCMV EAE) or MEM only (bottom left panel, EAE). Five weeks p.i. EAE was induced with or without (MOG CFA) pertussis toxin. At day 28 post EAE induction (similar results obtained at day 15 post EAE induction), mice were perfused and brains were embedded in OCT, snap frozen, cut and stained with antibodies specific for CD4 (D), CD8 (E) and F4/80 (F). The pictures are representative of three separate experiments (n = 16/group). Scale bar: 100 µm.
Figure 4
Figure 4. γHV-68 EAE mice show MS-like lesions in the white matter of the cerebellum and in the corpus callosum.
Mice were infected with γHV-68 or MEM only. Five weeks p.i. EAE was induced. At day 28 post EAE induction mice were perfused and brains were embedded in OCT, snap frozen, cut and stained with antibodies specific for CD4, CD8 and F4/80; or were formalin fixed and embedded in paraffin and stained with luxol fast blue. (A–B) The images displayed for CD4-CD8-F4/80 staining are consecutive sections cut from the same cerebral hemisphere of the same mouse (all images from γHV-68 EAE mice). Scale bar: 50 µm. (C) The arrows show an area of demyelination in the cerebellum of a γHV-68 EAE mouse and the asterisks highlight immune cell infiltrations. The right panel shows a normal cerebellum from a naïve EAE mouse. Scale bar: 100 µm. All pictures are representative of two separate experiments (n = 16/group).
Figure 5
Figure 5. CD8 T cells infiltrating in the CNS of γHV-68 EAE mice express granzyme B and are specific for viral proteins.
Mice were infected with γHV-68 or MEM only. Five weeks p.i. EAE was induced. At day 14–16 post EAE induction (mean clinical score of 3 for γHV-68 EAE mice, EAE mice were harvested at the same time), mice were perfused, brains and spinal cords were harvested and processed to isolate immune infiltrates. (A) Representative FACS plots showing the percentages of CD8 T cells infiltrating in the spinal cords (similar results were obtained in the brains) and histogram (B) showing the number of CD8+ granzyme B+ T cells infiltrating in the spinal cords and in the brains (immune cells were not restimulated before granzyme B staining). Two separate experiments with 6 mice/group, data analyzed with t-test. (C) Representative FACS plots showing percentages of CD8+ T cells with TCR specific for γHV-68 epitopes (p56 and p79) in the spleen of EAE mice (negative control); in the spleen of γHV-68 EAE mice (positive control; 3.3±1.6%), in the spinal cord (3.4±0.5%) and in the brain (4.9±0.5%) of γHV-68 EAE mice. Two separate experiments with 6 mice/group, errors are s.d.
Figure 6
Figure 6. γHV-68 EAE mice show increased T cell expression of IFN-γ and T-bet, accompanied by IL-17 suppression.
Mice were infected with γHV-68 (black bars, shaded histograms) or MEM only (open bars, open histograms). Five weeks p.i. EAE was induced. At day 14–16 post EAE induction (mean clinical score of 3 for γHV-68 EAE mice, EAE mice were harvested at the same time), mice were perfused, brains (left panels) and spinal cords (right panels) were harvested and processed to isolate immune infiltrates that were restimulated ex-vivo with PMA and ionomycin before performing FACS intra cellular staining. (A) Percentages of infiltrating CD3+ CD4+ IFN-γ+ lymphocytes. (B) Percentage of infiltrating CD3+ CD8+ IFN-γ lymphocytes (EAE CD8 infiltrations were not enough to perform FACS). (C) CD3+ CD4+ IL-17+ lymphocytes. Three separate experiments with 8-6 mice/group. Data were analyzed with t-test: ** p<0.01, * p<0.05. (D) T-bet and ROR-γt levels in CD3+ CD4+ IFN-γ± IL-17± lymphocytes in the spinal cords (similar results obtained from the brains) of γHV-68 EAE mice (grey shaded histograms) or EAE mice (open histograms). Representative histograms of two separate experiments with 6–8 mice/group.
Figure 7
Figure 7. γHV-68 EAE mice show increased levels of pro-inflammatory cytokines and chemokines and a decreased anti-MOG IgG1/IgG2a ratio in the serum.
Mice were infected i.p. with γHV-68 (black bars) or MEM only (open bars). Five weeks p.i., EAE was induced. At day 10, 15 and 28 post EAE induction blood was harvested through a cardiac puncture and the levels of different (A) cytokines (day 28 shown here) and (B) chemokines (day 10 shown here) were evaluated using BD Cytometric Bead Array kits. Data from day 28 are shown for both IFN-γ and TNF-α; similar results were obtained at day 10 and 15 post EAE induction. Three-two separate experiments for each time point with 3–6 mice/group. Data were analyzed with t-test: *** p<0.001; ** p<0.01, * p<0.05. (C–D) Serum was harvested at day 28 post EAE and the levels of (C) total anti-MOG IgG (left panel), total anti-brain extract IgG (right panel) and (D) anti-MOG IgG1 and IgG2a were quantified through ELISA. Two separate experiments with 8 mice/group. Data were analyzed with t-test: ** p<0.01; and Mann-Whitney U test: * p<0.05.
Figure 8
Figure 8. CD11b+ CD11c+ cells from γHV-68 EAE mice are able to prime an enhanced Th1 response both in vitro and in vivo.
Mice were infected with γHV-68 or MEM only. Five weeks p.i., EAE was induced. At day 4 post EAE induction, spleens and lymph nodes were harvested and CD11b+CD11c+ cells were isolated. CD4 T cells from 2D2 mice were isolated at the same time. CD11b+CD11c+ were incubated with 2D2 CD4 T cells and different concentrations of MOG peptide for 72 hours. T cells were restimulated and stained to assess the production of IFN-γ (A) Representative FACS plot showing IFN-γ production in 2D2 CD4 T cells after incubation with CD11b+CD11c+ cells isolated from a γHV-68 EAE mouse (upper right panel) or a naïve EAE mouse (upper left panel) and MOG peptide (100 µM). Lowers panels show the negative controls with/without MOG and with/without restimulation. (B) Histograms showing the percentages of 2D2 CD4 T cells producing IFN-γ after incubation with CD11b+CD11c+ cells from a γHV-68 EAE mouse (black bars) or a naïve EAE mouse (open bars) and 10 µM (left panel) or 100 µM (right panel) MOG peptide. Three separate experiments with triplicate wells for each group. Data were analyzed with t-test: *** p<0.001. (C) Levels of MHC II, MHC I and CD40 expressed on CD11b+CD11c+ isolated from the spleens of γHV-68 EAE mice (grey shaded histograms) or a naïve EAE mice (open histograms) at day 4 post EAE induction. (D) CD11b+CD11c+ isolated from both γHV-68 EAE and naïve EAE mice at day 4 post EAE were transferred into naïve mice. Twenty-four hours later EAE was induced in both groups. At day 14–16 post EAE induction (mean clinical score between 2 and 3 for both groups), brains and spinal cords were harvested and the production of IFN-γ and IL-17 by CD4 T cells in the CNS of mice that received CD11b+CD11c+ cells from γHV-68 EAE mice (black bars) or from naive EAE mice (open bars) was assessed after in-vitro restimulation with PMA and ionomycin. Results obtained from the spinal cords are shown, a similar trend was observed in the brain. Three separate experiments with 5 mice/group. Data were analyzed with t-test: * p<0.05.

Similar articles

Cited by

References

    1. Sospedra M, Martin R. Immunology of multiple sclerosis. Annu Rev Immunol. 2005;23:683–747. - PubMed
    1. Ascherio A, Munger KL. Environmental risk factors for multiple sclerosis. Part I: the role of infection. Ann Neurol. 2007;61:288–299. - PubMed
    1. Bornkamm GW, Hammerschmidt W. Molecular virology of Epstein-Barr virus. Philos Trans R Soc Lond B Biol Sci. 2001;356:437–459. - PMC - PubMed
    1. Jones K, Rivera C, Sgadari C, Franklin J, Max EE, et al. Infection of human endothelial cells with Epstein-Barr virus. J Exp Med. 1995;182:1213–1221. - PMC - PubMed
    1. Savard M, Belanger C, Tardif M, Gourde P, Flamand L, et al. Infection of primary human monocytes by Epstein-Barr virus. J Virol. 2000;74:2612–2619. - PMC - PubMed

Publication types

MeSH terms