. 2012;8(5):e1002643.
doi: 10.1371/journal.pgen.1002643. Epub 2012 May 17.

Separation of DNA replication from the assembly of break-competent meiotic chromosomes

Affiliations

Separation of DNA replication from the assembly of break-competent meiotic chromosomes

Hannah G Blitzblau et al. PLoS Genet. 2012.

Abstract

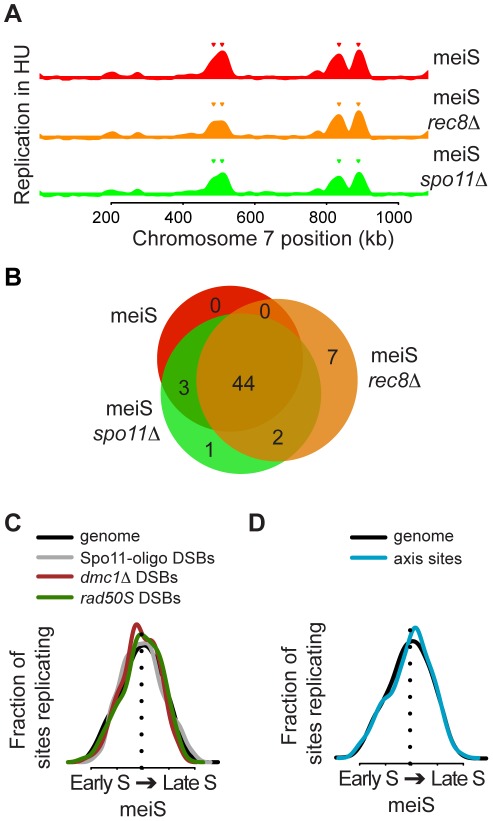
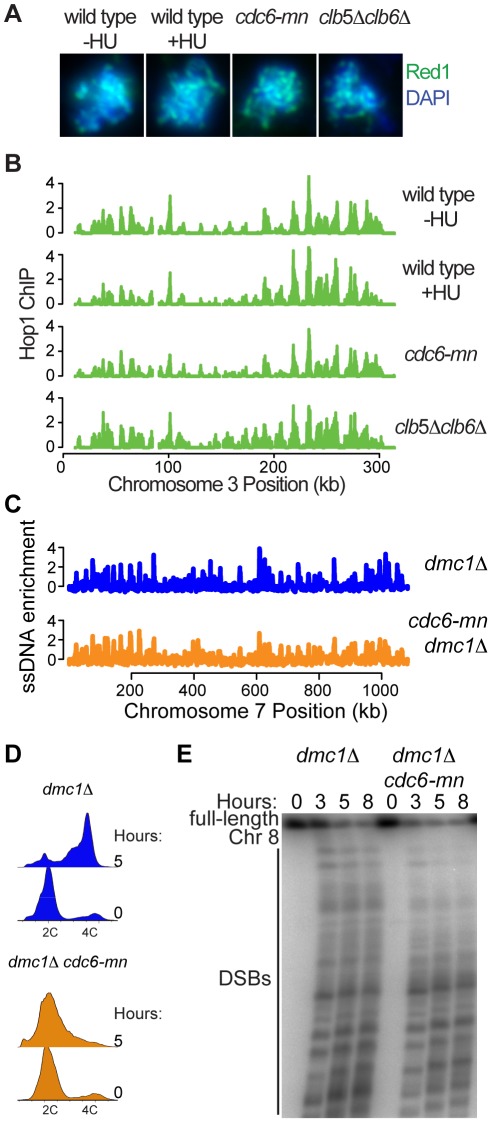
The meiotic cell division reduces the chromosome number from diploid to haploid to form gametes for sexual reproduction. Although much progress has been made in understanding meiotic recombination and the two meiotic divisions, the processes leading up to recombination, including the prolonged pre-meiotic S phase (meiS) and the assembly of meiotic chromosome axes, remain poorly defined. We have used genome-wide approaches in Saccharomyces cerevisiae to measure the kinetics of pre-meiotic DNA replication and to investigate the interdependencies between replication and axis formation. We found that replication initiation was delayed for a large number of origins in meiS compared to mitosis and that meiotic cells were far more sensitive to replication inhibition, most likely due to the starvation conditions required for meiotic induction. Moreover, replication initiation was delayed even in the absence of chromosome axes, indicating replication timing is independent of the process of axis assembly. Finally, we found that cells were able to install axis components and initiate recombination on unreplicated DNA. Thus, although pre-meiotic DNA replication and meiotic chromosome axis formation occur concurrently, they are not strictly coupled. The functional separation of these processes reveals a modular method of building meiotic chromosomes and predicts that any crosstalk between these modules must occur through superimposed regulatory mechanisms.


Conflict of interest statement

The authors have declared that no competing interests exist.

Figures

Figure 1
Figure 1. Transcription influences origin selection.
(A) Mcm2-7 localization was performed for cln3Δ cells (A4224) prior to meiosis and a wild-type strain (SB1505) prior to mitosis. Mcm2-7 enrichment was plotted versus chromosome position for chromosome IX for meiotic cells (red, enrichment is upwards) and mitotic cells (blue, enrichment is downwards). Inverted red and blue triangles indicate significant Mcm2-7 binding sites. Black arrowheads indicate the positions of ARS913 and the SPO22 ARS. (B) As in (A), except a detailed view of ARS913 (left) and the SPO22 ARS (right) as indicated by arrowheads. The schematic above indicates the locations of coding regions. (C) Quantification of the change in gene expression for genes next to meiosis-specific (red), mitosis-specific (blue) and all other (white) Mcm2-7 binding sites. (D) Histogram showing the distribution of the calculated distances between Mcm2-7 binding sites prior to meiosis (red, left panel) and mitosis (blue, right panel).
Figure 2
Figure 2. Meiotic DNA replication profiles.
(A) Ime2-as1-myc homozygous diploid cells (KBY518) were synchronized in meiS. DNA samples were collected every 7.5 minutes. Resulting samples were pooled and co-hybridized with a G1 DNA sample to a tiled genomic microarray. (B) Replication profiles for meiS (KBY518, red line), mitS (SB1505, blue line) and control G1 vs. G1 (SB1505, grey line) hybridizations were created by plotting the smoothed log2 ratio (see Materials and Methods) versus chromosome VII position. Triangles indicate the positions of Mcm2-7 binding sites prior to meiosis (red) and mitosis (blue). (C) The distribution of relative replication time for all origins (colored lines) and for the entire genome (black lines) is plotted for meiS (left panel) and mitS phase (right panel). (D) The replication time in meiS of Mcm2-7 binding sites that were present in both cell cycles were plotted as a function of mitS replication time. Assuming meiS is twice as long as mitS, the orange dashed line indicates the predicted meiS replication time if origins replicated with the same kinetics in meiS and mitS. The blue dashed line is the predicted replication time trend line if scaling were linear with respect to S phase length. The purple solid line is the second order polynomial best-fit model.
Figure 3
Figure 3. Reduced replication initiation in meiS.
Pre-sporulation cultures of wild-type cells (H574) were inoculated into either SPO (top row) or YPD (bottom row) in the absence or presence of the indicated concentrations of HU or urea. (A) Comparison of response to HU in meiS and mitS as measured by FACS analysis. (B) Western blot analysis of Rad53 phosphorylation after 4 hours incubation in SPO (top panel) or YPD (bottom panel). (C) Western blot analysis of Orc6 phosphorylation in cells from the SPO cultures to monitor activation of CDK at the time of S phase entry. (D) The relative copy number enrichment of cells after 4 hours in 200 mM HU (mitS) or 20 mM HU (meiS) is plotted relative to chromosome VII position for wild-type (H574, blue for mitS and red for meiS) and sml1Δ cells (H4898, purple). (E) The total number of origins replicated in each of the conditions in (D) is represented as a Venn diagram.
Figure 4
Figure 4. Centromeres replicate early in S phase.
(A) The average expression level of origin proximal genes is plotted versus the time of replication in meiS. The red dotted lines indicate the population average. (B) The expression level distributions for meiS (left) and mitS (right) are plotted for the genes surrounding each origin for meiS early origins (red boxes) and mitS-only early origins (blue boxes). (C) The replication time for each centromere is indicated as a gray vertical bar compared to the distribution of replication time for the whole genome (black line) in meiS (left panel) and mitS (right panel). The mean replication time of the genome is indicated by the black dotted lines for each panel. (D) The replication time of each origin is plotted as a function of the distance of the origin from the closest centromere. MeiS early origins are indicated in red, mitS-only early origins are indicated in blue and late origins are colored black. (E) The data from (D) are summarized as box and whisker plots, with significance of the difference between mei-S and mitS-only early origins indicated.
Figure 5
Figure 5. No relationship between DNA replication timing and recombination sites.
(A) Chromosome VII replication profiles for pre-meiotic cells in the presence of 20 mM HU are shown for wild-type (H574, red), rec8Δ (H5187, orange) and spo11Δ (H5184, green) cells. Inverted triangles indicate the position of origins that are considered replicated in each strain. (B) Venn diagram summary of the experiment shown in (A), with the same color coding. (C) The distributions of replication timing in meiS are shown for the entire genome (black line), DSBs hotspots mapped by Spo11-oligo recovery (gray line), ssDNA enrichment in a dmc1Δ strain (brown line) and Spo11 binding in rad50S cells (green line). (D) The distributions of replication timing in meiS are shown for the entire genome (black line) and for axis association sites (blue line).
Figure 6
Figure 6. DNA replication is not required for axis association or DSB formation.
(A) Indirect immunofluorescence for Red1 (green) and DAPI staining for total DNA (blue) on spread nuclei from cells at 3 hours after inoculation into SPO for wild-type cells (H119) with and without HU, cdc6-mn cells (H154) and clb5Δ clb6Δ cells (H2017). (B) Hop1 localization analysis was performed for wild-type cells with (H4471) and without HU (H119, [67]), cdc6-mn cells (H154) and clb5Δ clb6Δ cells (H2017). The enrichment of Hop1 over input DNA is plotted for chromosome III. (C) ssDNA enrichment in dmc1Δ cells (H118, [67]), and dmc1Δ cdc6-mn cells (H1584) was plotted with respect to position on chromosome VII. (D) FACS analysis was performed for dmc1Δ (H118) and dmc1Δ cdc6-mn cells (H1584). (E) CHEF gel analysis of chromosome VIII during a meiotic time course using dmc1Δ (H118) and dmc1Δ cdc6-mn cells (H4534).

Comment in

  • Slowing replication in preparation for reduction.
    Lawrence KS, Engebrecht J. Lawrence KS, et al. PLoS Genet. 2012;8(5):e1002715. doi: 10.1371/journal.pgen.1002715. Epub 2012 May 17. PLoS Genet. 2012. PMID: 22615580 Free PMC article. No abstract available.

References

    1. Moens PB, Pearlman RE. Chromatin organization at meiosis. Bioessays. 1988;9:151–153. - PubMed
    1. Zickler D, Kleckner N. Meiotic chromosomes: integrating structure and function. Annu Rev Genet. 1999;33:603–754. - PubMed
    1. Williamson DH, Johnston LH, Fennell DJ, Simchen G. The timing of the S phase and other nuclear events in yeast meiosis. Exp Cell Res. 1983;145:209–217. - PubMed
    1. Padmore R, Cao L, Kleckner N. Temporal comparison of recombination and synaptonemal complex formation during meiosis in S. cerevisiae. Cell. 1991;66:1239–1256. - PubMed
    1. Herrick J. The dynamic replicon: adapting to a changing cellular environment. Bioessays. 2010;32:153–164. - PubMed

Publication types

Substances