. 2012 May 15:3:69.
doi: 10.3389/fneur.2012.00069. eCollection 2012.

Selective rapid eye movement sleep deprivation affects cell size and number in kitten locus coeruleus

Affiliations

Selective rapid eye movement sleep deprivation affects cell size and number in kitten locus coeruleus

James P Shaffery et al. Front Neurol. .

Abstract

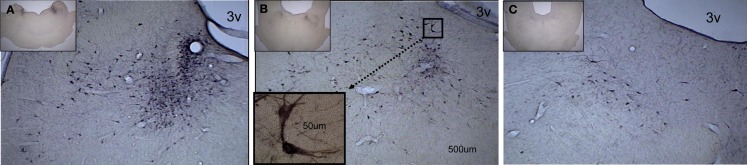
Cells in the locus coeruleus (LC) constitute the sole source of norepinephrine (NE) in the brain and change their discharge rates according to vigilance state. In addition to its well established role in vigilance, NE affects synaptic plasticity in the postnatal critical period (CP) of development. One form of CP synaptic plasticity affected by NE results from monocular occlusion, which leads to physiological and cytoarchitectural alterations in central visual areas. Selective suppression of rapid eye movement sleep (REMS) in the CP kitten enhances the central effects of monocular occlusion. The mechanisms responsible for heightened cortical plasticity following REMS deprivation (REMSD) remain undetermined. One possible mediator of an increase in plasticity is continuous NE outflow, which presumably persists during extended periods of REMSD. Tyrosine hydroxylase (TH) is the rate-limiting enzyme in the synthesis of NE and serves as a marker for NE-producing cells. We selectively suppressed REMS in kittens for 1 week during the CP. The number and size of LC cells expressing immunoreactivity to tyrosine hydroxylase (TH-ir) was assessed in age-matched REMS-deprived (RD)-, treatment-control (TXC)-, and home cage-reared (HCC) animals. Sleep amounts and slow wave activity (SWA) were also examined relative to baseline. Time spent in REMS during the study was lower in RD compared to TXC animals, and RD kittens increased SWA delta power in the latter half of the REMSD period. The estimated total number of TH-ir cells in LC was significantly lower in the RD than in the TXC kittens and numerically lower than in the HCC animals. The size of LC cells expressing TH-ir was greatest in the HCC group. HCC cells were significantly larger than TH-ir cells in the RD kittens. These data are consistent with presumed reduction in NE in forebrain areas, including visual cortex, caused by 1 week of REMSD.

Keywords: critical period; depression; fast Fourier transforms; norepinephrine; stereology.


Figures

Figure 1
Figure 1
Proportion of time spent in each of three vigilance states is graphed for the four 24 h periods analyzed within the 8-day experimental protocol (baseline day and 7 shaker days). On each graph, the percent times spent in REMS, rapid eye movement sleep; SWS, slow wave sleep, and waking (WAKE) are plotted. RD = green bars; TXC = yellow bars; **significantly different from corresponding TXC mean; p = 0.001 (Bonferroni corrected post hoc t-tests).
Figure 2
Figure 2
Changes in ECoG delta power by group. Average delta power during 30 artifact-free, 4 s periods of SWS is plotted for each group on the baseline day and shaker days 3 and 6. The DAY by GROUP interaction is significant (F = 7.13, df = 2.10, p = 0.012). The RD group (green bars) successively increases delta power whereas the TXC group (yellow bars) first shows slightly decreased delta power that later levels off. Post hoc comparisons between the two groups do not reach statistical significance on any single day, but trended toward differences between each other on DAY 3 and DAY6 (p = 0.051, p = 0.056, respectively; Bonferroni corrected post hoc t-tests). The rising delta power in the RD group’s SWS achieved significance in its difference from baseline on DAY6 (*p = 0.047).
Figure 3
Figure 3
A caudal-to-rostral subset of photomicrographs, taken from the complete series of midbrain coronal sections, showing darkly stained cell bodies evenly distributed throughout the medial–lateral aspect of the locus coeruleus. The low-power (2.5×) insert on each photomicrograph indicates the caudal-to-rostral level of the higher-power (10×) enlargement. (A) Higher densities of TH-ir cells are found at the more caudal sites. The scale bar is the same on three of the photomicrographs and applies to the high-power (10×) picture. (B) At this level, fewer TH-ir cells are seen. The insert shows a higher-power (63×) view of a pair of TH-ir cells. Their location in the 10× section is indicated by the dotted line connecting the two boxes. (C) The most rostral section has the fewest TH-ir cells. 3v designates the third ventricle.
Figure 4
Figure 4
Estimated total number of TH-ir cells in the locus coeruleus in the three kitten groups. Values are based on fractionator stereological probe data, which provide statistically non-biased estimates of total number of cells in an area of interest. Home cage-reared (HCC)-, shaker-control (TXC)-, and RD groups are indicated on the abscissa. HCC = red bar; TXC = yellow bar; RD = green bar; * = different from TXC, p = 0.024 (Bonferroni post hoc corrected t-test).
Figure 5
Figure 5
Mean area of TH-ir cells measured in the locus coeruleus in each group. The nucleator probe, utilized in conjunction with the fractionator, provides the estimated value of cell size. Group designations are as given in Figure 4. HCC = red bar; TXC = yellow bar; RD = green bar;* = different from HCC, p = 0.039 (Bonferroni post hoc corrected t-test).

References

    1. Abercrombie E. D., Jacobs B. L. (1987). Single-unit response of noradrenergic neurons in the locus coeruleus of freely moving cats. I. Acutely presented stressful and nonstressful stimuli. J. Neurosci. 7, 2837–2843 - PMC - PubMed
    1. Asbach S., Schulz C., Lehnert H. (2001). Effects of corticotropin-releasing hormone on locus coeruleus neurons in vivo: a microdialysis study using a novel bilateral approach. Eur. J. Endocrinol. 145, 359–36310.1530/eje.0.1450359 - DOI - PubMed
    1. Aston-Jones G., Chiang C., Alexinsky T. (1991). Discharge of noradrenergic locus coeruleus neurons in behaving rats and monkeys suggests a role in vigilance. Prog. Brain Res. 88, 501–52010.1016/S0079-6123(08)63830-3 - DOI - PubMed
    1. Bear M. F., Paradiso M. A., Schwartz M., Nelson S. B., Carnes K. M., Daniels J. D. (1983). Two methods of catecholamine depletion in kitten visual cortex yield different effects on plasticity. Nature 302, 245–24710.1038/302245a0 - DOI - PubMed
    1. Bear M. F., Singer W. (1986). Modulation of visual cortical plasticity by acetylcholine and noradrenaline. Nature 320, 172–17610.1038/320172a0 - DOI - PubMed