. 2012;7(5):e36574.
doi: 10.1371/journal.pone.0036574. Epub 2012 May 16.

Residency and spatial use by reef sharks of an isolated seamount and its implications for conservation

Affiliations

Residency and spatial use by reef sharks of an isolated seamount and its implications for conservation

Adam Barnett et al. PLoS One. 2012.

Abstract

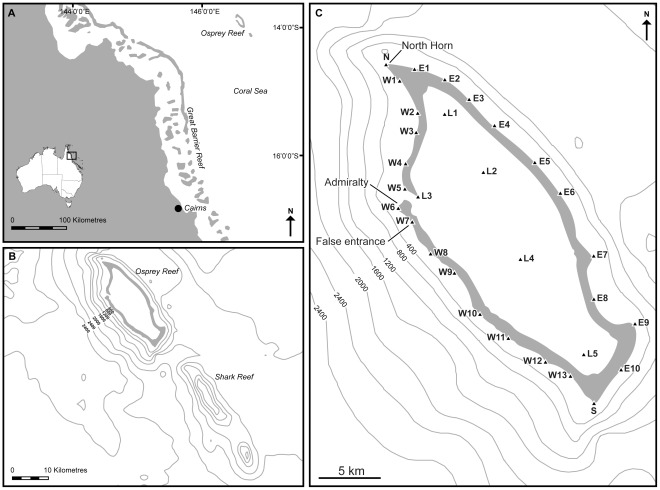
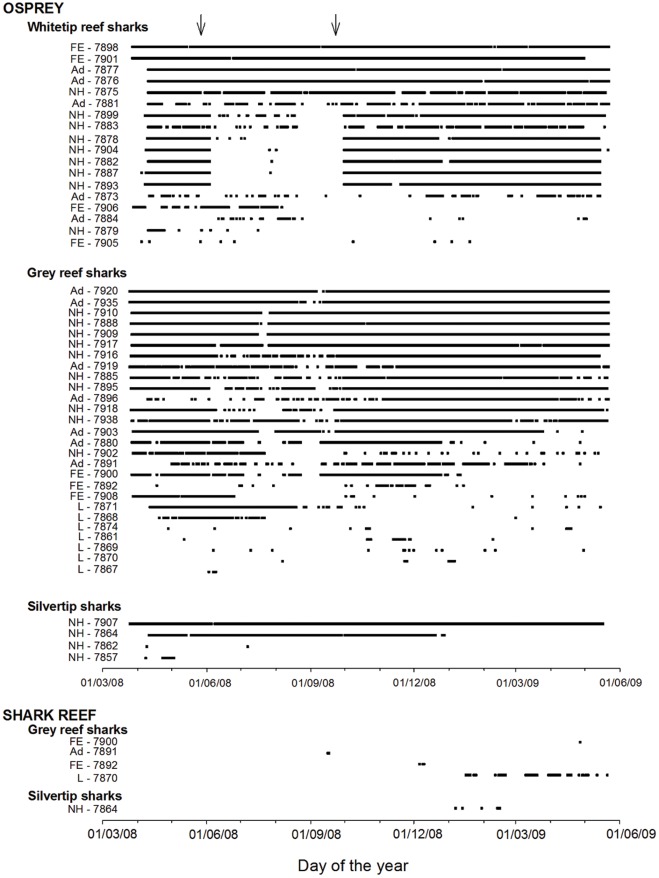
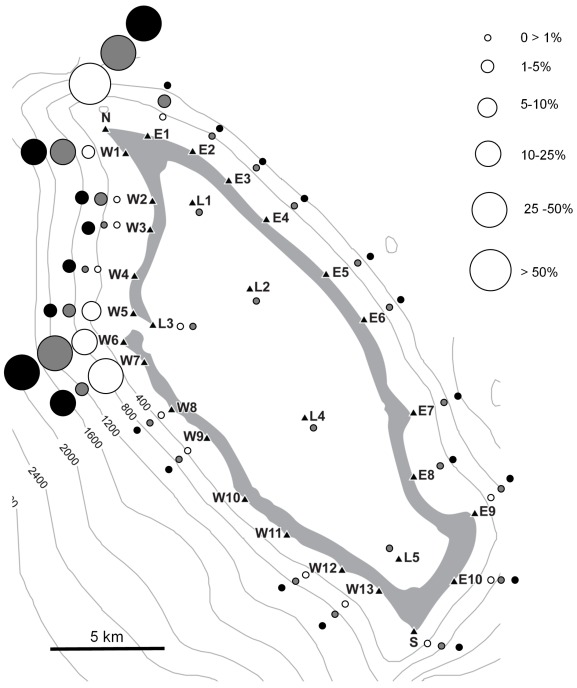
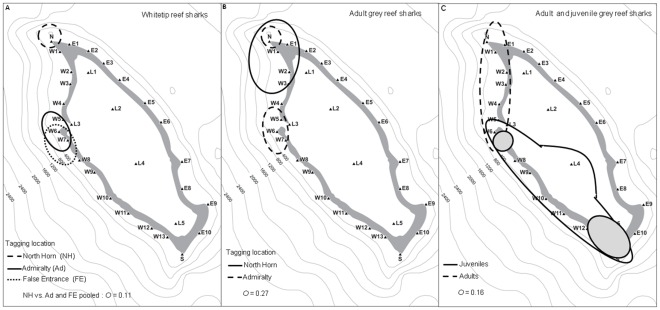
Although marine protected areas (MPAs) are a common conservation strategy, these areas are often designed with little prior knowledge of the spatial behaviour of the species they are designed to protect. Currently, the Coral Sea area and its seamounts (north-east Australia) are under review to determine if MPAs are warranted. The protection of sharks at these seamounts should be an integral component of conservation plans. Therefore, knowledge on the spatial ecology of sharks at the Coral Sea seamounts is essential for the appropriate implementation of management and conservation plans. Acoustic telemetry was used to determine residency, site fidelity and spatial use of three shark species at Osprey Reef: whitetip reef sharks Triaenodon obesus, grey reef sharks Carcharhinus amblyrhynchos and silvertip sharks Carcharhinus albimarginatus. Most individuals showed year round residency at Osprey Reef, although five of the 49 individuals tagged moved to the neighbouring Shark Reef (~14 km away) and one grey reef shark completed a round trip of ~250 km to the Great Barrier Reef. Additionally, individuals of white tip and grey reef sharks showed strong site fidelity to the areas they were tagged, and there was low spatial overlap between groups of sharks tagged at different locations. Spatial use at Osprey Reef by adult sharks is generally restricted to the north-west corner. The high residency and limited spatial use of Osprey Reef suggests that reef sharks would be highly vulnerable to targeted fishing pressure and that MPAs incorporating no-take of sharks would be effective in protecting reef shark populations at Osprey and Shark Reef.


Conflict of interest statement

Competing Interests: Funding for this project was from a commercial source, Digital Dimensions. Richard Fitzpatrick and Adam Barnett are affiliated with a commercial company The Reef Channel. This does not alter the authors' adherence to all the PLoS ONE policies on sharing data and materials.

Figures

Figure 1
Figure 1. Location of Osprey Reef in the Coral Sea, Australia (A and B).
Panel C shows the depth contours (in metres) around Osprey Reef, the VR2 receiver array forming a ring around the perimeter of Osprey Reef, and the 5 receivers within the lagoon. Triangles represent receivers. North Horn, Admiralty and False Entrance are the shark tagging locations.
Figure 2
Figure 2. Timeline of the daily detections of acoustic coded individual sharks at Osprey Reef from March 2008 to June 2009.
Individuals are classified by their tagging location (FE- False Entrance, Ad- Admiralty, NH – North Horn, L – lagoon) and acoustic transmitter ID. Note that all grey reef sharks tagged in the lagoon were juveniles. The arrows at the top of the graph represent the period from the 4th June to the 29th September when the North Horn (N) receiver had a battery failure.
Figure 3
Figure 3. Bubble plot showing the percentage of hours that each species was detected at each receiver.
White circles - whitetip reef sharks; grey circles - grey reef sharks; black circles - silvertip sharks.
Figure 4
Figure 4. Area use maps, showing the 95% contours of the number of hours of detection occurred for sharks at different tagging locations and the comparison of spatial use with Pianka’s niche overlap value (O), where 0 represents no overlap and 1 equals total overlap.
Panel A - whitetip reef sharks tagged at three locations.Note that for the O value calculation, sharks tagged at Admiralty and False Entrance were pooled and compared with North Horn individuals. Panel B – Adult grey reef sharks tagged at two locations. Panel C – All adult grey reef sharks compared with juveniles. The grey shaded area represents the 80% contours of juvenile hourly detections.
Figure 5
Figure 5. Fast Fourier transform of the time series of number of detections per hour for one representative individual of each species at receivers N and W6.
Periodicities of peaks are given over the peaks. Receivers N and W6 were chosen for this analysis because these correspond to the tagging areas, and most individuals spent a large part of their time in the vicinity of the tagging place throughout the study. Therefore, data from these receivers provides more complete information on the dial activity periodicity. FFT analysis for the other adult individuals of the three species that were regularly detected at these receivers throughout the course of the study led to similar results.
Figure 6
Figure 6. Circular plots showing the distribution of the number of individuals detected at each hour of the day for each of the main receivers (in % of total) for whitetip and grey reef sharks.
Note the differences in scale between plots. Different shadings represent the number of sharks detected in a given hour.

References

    1. Pichegru L, Ryan PG, Le Bohec C, van der Lingen CD, Navarro R, et al. Overlap between vulnerable top predators and fisheries in the Benguela upwelling system: implications for marine protected areas. Marine Ecology-Progress Series. 2009;391:199–208.
    1. Myers RA, Worm B. Extinction, survival or recovery of large predatory fishes. Philosophical Transactions of the Royal Society B-Biological Sciences. 2005;360:13–20. - PMC - PubMed
    1. Baum JK, Worm B. Cascading top-down effects of changing oceanic predator abundances. Journal of Animal Ecology. 2009;78:699–714. - PubMed
    1. Kirkwood R, Pemberton D, Gales R, Hoskins AJ, Mitchell T, et al. Continued population recovery by Australian fur seals. Mar Freshw Res. 2010;61:695–701.
    1. Pauly D, Christensen V, Dalsgaard J, Froese R, Torres F. Fishing down marine food webs. Science. 1998;279:860–863. - PubMed

Publication types