

Millipede taxonomy after 250 years: classification and taxonomic practices in a mega-diverse yet understudied arthropod group
- PMID: 22615951
- PMCID: PMC3352885
- DOI: 10.1371/journal.pone.0037240
Millipede taxonomy after 250 years: classification and taxonomic practices in a mega-diverse yet understudied arthropod group
Abstract
Background: The arthropod class Diplopoda is a mega-diverse group comprising >12,000 described millipede species. The history of taxonomic research within the group is tumultuous and, consequently, has yielded a questionable higher-level classification. Few higher-taxa are defined using synapomorphies, and the practice of single taxon descriptions lacking a revisionary framework has produced many monotypic taxa. Additionally, taxonomic and geographic biases render global species diversity estimations unreliable. We test whether the ordinal taxa of the Diplopoda are consistent with regards to underlying taxonomic diversity, attempt to provide estimates for global species diversity, and examine millipede taxonomic effort at a global geographic scale.
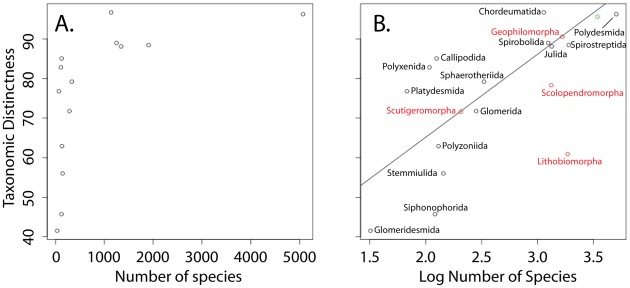
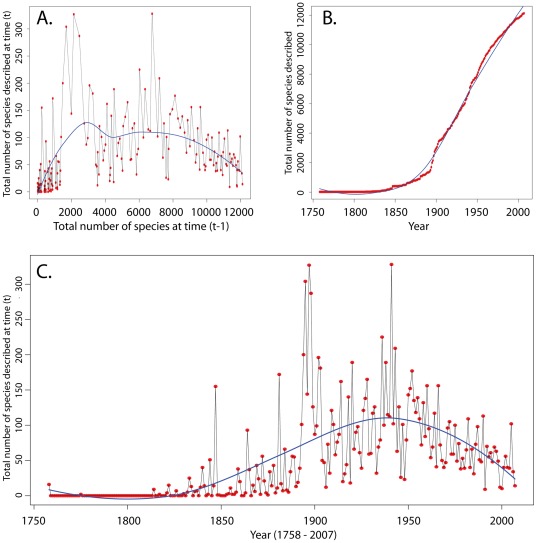
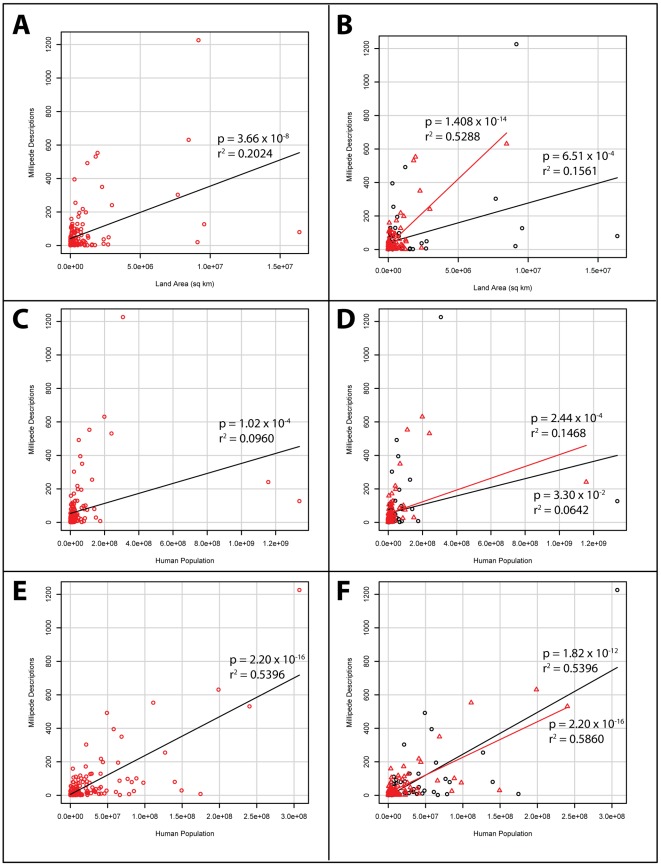
Methodology/principal findings: A taxonomic distinctness metric was employed to assess uniformity of millipede ordinal taxa. We found that ordinal-level taxa are not uniform and are likely overinflated with higher-taxa when compared to related groups. Several methods of estimating global species richness were employed (Bayesian, variation in taxonomic productivity, extrapolation from nearly fully described taxa). Two of the three methods provided estimates ranging from 13,413-16,760 species. Variations in geographic diversity show biases to North America and Europe and a paucity of works on tropical taxa.
Conclusions/significance: Before taxa can be used in an extensible way, they must be definable with respect to the diversity they contain and the diagnostic characters used to delineate them. The higher classification for millipedes is shown to be problematic from a number of perspectives. Namely, the ordinal taxa are not uniform in their underlying diversity, and millipedes appear to have a disproportionate number of higher-taxa. Species diversity estimates are unreliable due to inconsistent taxonomic effort at temporal, geographic, and phylogenetic scales. Lack of knowledge concerning many millipede groups compounds these issues. Diplopods are likely not unique in this regard as these issues may persist in many other diverse yet poorly studied groups.
Conflict of interest statement
Figures
References
-
- Warwick RM, Somerfield PJ. All animals are equal, but some animals are more equal than others. Journal of Experimental Marine Biology and Ecology. 2008;366:184–186. doi: doi:10.1016/j.jembe.2008.07.023. - DOI
-
- Clarke K, Warwick R. A taxonomic distinctness index and its statistical properties. J Appl Ecol. 1998;35:523–531.
-
- Gaston K, Williams P. Mapping the World's Species-The Higher Taxon Approach. Biodiversity Letters. 1993;1:2–8.
-
- Williams P, Gaston K. Measuring more of biodiversity: can higher-taxon richness predict wholesale species richness? Biol Conserv. 1994;67:211–217.
-
- Cardoso P, Silva I, de Oliveira N, Serrano A. Higher taxa surrogates of spider (Araneae) diversity and their efficiency in conservation. Biol Conserv. 2004;117:453–459. doi: 10.1016/j.biocon.2003.08.013. - DOI
Publication types
MeSH terms
LinkOut - more resources
Full Text Sources
Other Literature Sources
