

Status of epidemiology in the WHO South-East Asia region: burden of disease, determinants of health and epidemiological research, workforce and training capacity
- PMID: 22617689
- PMCID: PMC3396314
- DOI: 10.1093/ije/dys046
Status of epidemiology in the WHO South-East Asia region: burden of disease, determinants of health and epidemiological research, workforce and training capacity
Abstract
Background: The South-East Asia region (SEAR) accounts for one-quarter of the world's population, 40% of the global poor and ∼30% of the global disease burden, with a disproportionately large share of tuberculosis (35%), injuries (30%), maternal (33%) and <5-year-old mortality (30%). In this article, we describe the disease burden and status of epidemiological research and capacity in the SEAR to understand, analyse and develop capacity in response to the diverse burdens of diseases in the region.
Methods: Data on morbidity, mortality, risk factors, social determinants, research capacity, health education, workforce and systems in the SEAR were obtained using global data on burden of disease, peer-reviewed journals, World Health Organization (WHO) technical and advisory reports, and where available, validated country reports and key informants from the region.
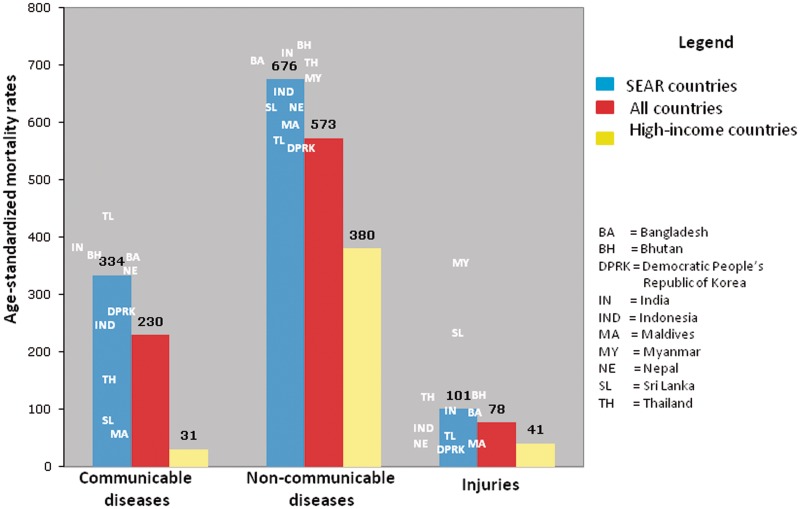
Results: SEAR countries are afflicted with a triple burden of disease-infectious diseases, non-communicable diseases and injuries. Of the seven WHO regions, SEAR countries account for the highest proportion of global mortality (26%) and due to relatively younger ages at death, the second highest percentage of total years of life lost (30%). The SEAR exceeds the global average annual mortality rate for all three broad cause groupings-communicable, maternal, perinatal and nutritional conditions (334 vs 230 per 100 000); non-communicable diseases (676 vs 573 per 100 000); and injuries (101 vs 78 per 100 000). Poverty, education and other social determinants of health are strongly linked to inequities in health among SEAR countries and within socio-economic subgroups. India, Thailand and Bangladesh produce two-thirds of epidemiology publications in the region. Significant efforts to increase health workforce capacity, research and training have been undertaken in the region, yet considerable heterogeneity in resources and capacity remains.
Conclusions: Health systems, statistics and surveillance programmes must respond to the demographic, economic and epidemiological transitions that define the current disease burden and risk profile of SEAR populations. Inequities in health must be critically analysed, documented and addressed through multi-sectoral approaches. There is a critical need to improve public health intelligence by building epidemiological capacity in the region.
Figures


Comment in
-
Mortality estimates for South East Asia, and INDEPTH mortality surveillance: necessary but not sufficient?Int J Epidemiol. 2013 Aug;42(4):1196-9. doi: 10.1093/ije/dyt033. Int J Epidemiol. 2013. PMID: 24062301 No abstract available.
-
Authors' response to: Mortality estimates for South East Asia, and INDEPTH mortality surveillance: necessary, but not sufficient.Int J Epidemiol. 2013 Aug;42(4):1200-1. doi: 10.1093/ije/dyt031. Int J Epidemiol. 2013. PMID: 24062303 Free PMC article. No abstract available.
References
-
- World Health Organization. 11 Questions About the 11 Sear Countries. New Delhi, India: World Health Organization; 2007.
-
- United Nations. World Population Prospects 2006. New York: The United Nations; 2007.
-
- World Health Organization. World Health Statistics 2011. Geneva: World Health Organization; 2011.
-
- World Health Organization. Global Burden of Disease: 2004 Update. Geneva: World Health Organization; 2008.
-
- World Health Organization. Global Health Risks: Mortality and Burden of Disease Attributable to Selected Major Risks. Geneva: World Health Organization; 2009.
