. 2012 Aug;43(8):2221-8.
doi: 10.1161/STROKEAHA.111.646224. Epub 2012 May 22.

Axonal outgrowth and dendritic plasticity in the cortical peri-infarct area after experimental stroke

Affiliations

Axonal outgrowth and dendritic plasticity in the cortical peri-infarct area after experimental stroke

Yuji Ueno et al. Stroke. 2012 Aug.

Abstract

Background and purpose: Axonal remodeling is critical to brain repair after stroke. The present study investigated axonal outgrowth after stroke and the signaling pathways mediating axonal outgrowth in cortical neurons.

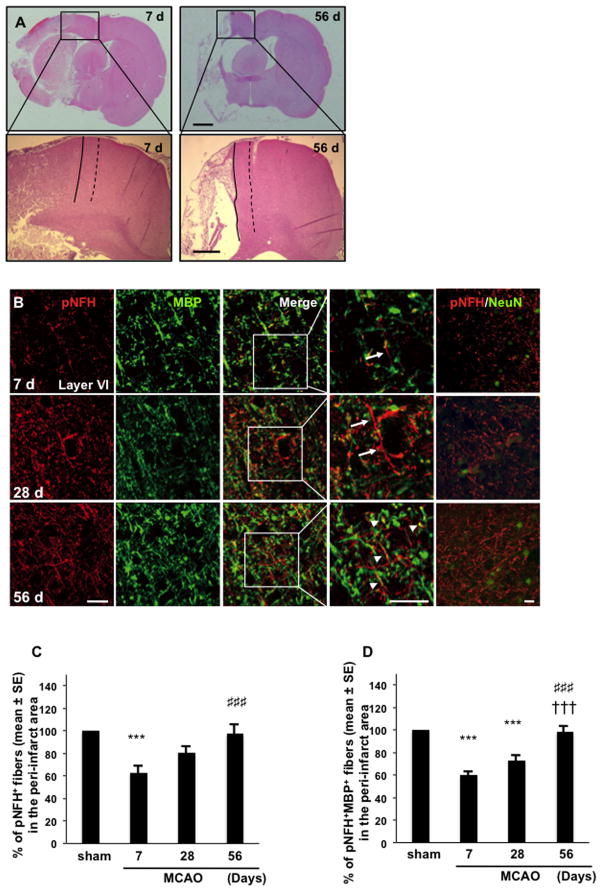
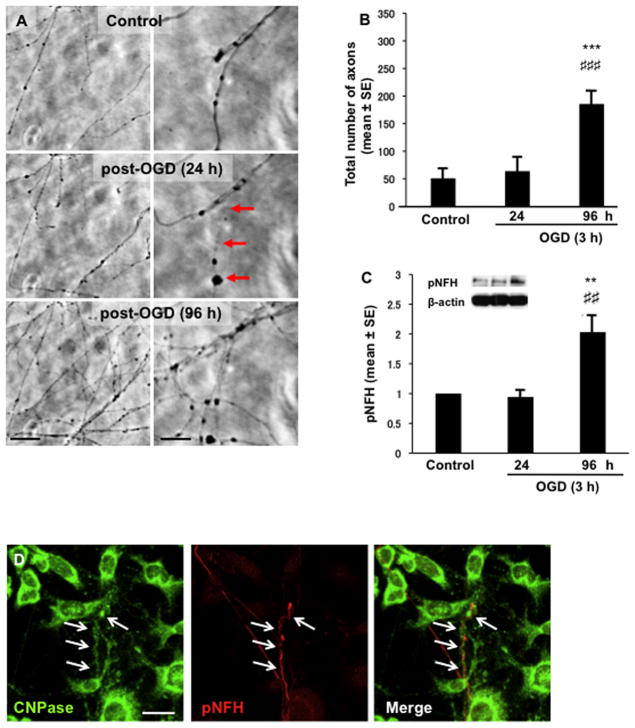
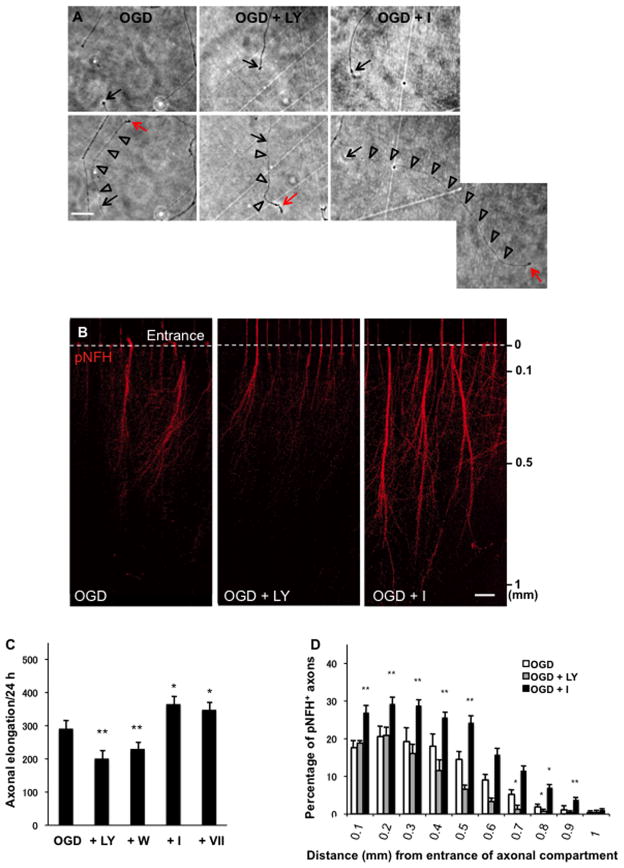
Methods: Using a rodent model of middle cerebral artery occlusion, we examined high-molecular weight neurofilament (NFH) immunoreactive axons and myelin basic protein-positive oligodendrocytes in the peri-infarct area. In vitro, using cultured cortical neurons in a microfluidic chamber challenged by oxygen-glucose deprivation (OGD), we investigated mechanisms selectively regulating axonal outgrowth after OGD.

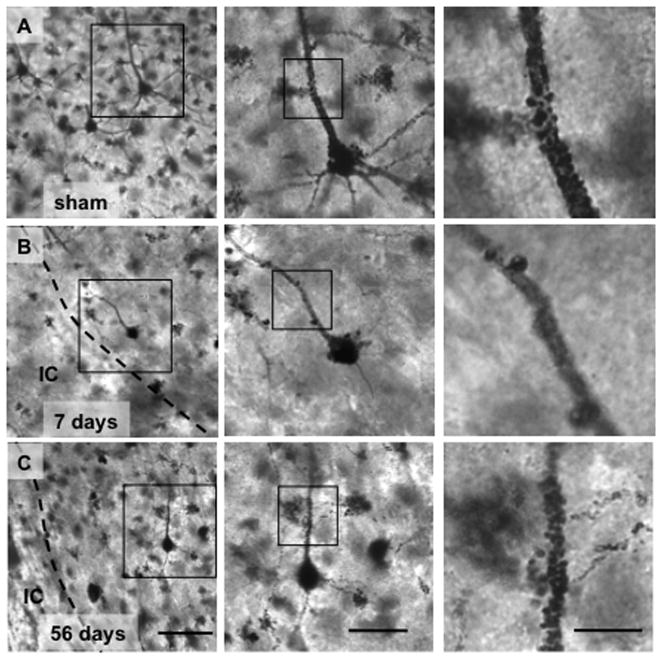
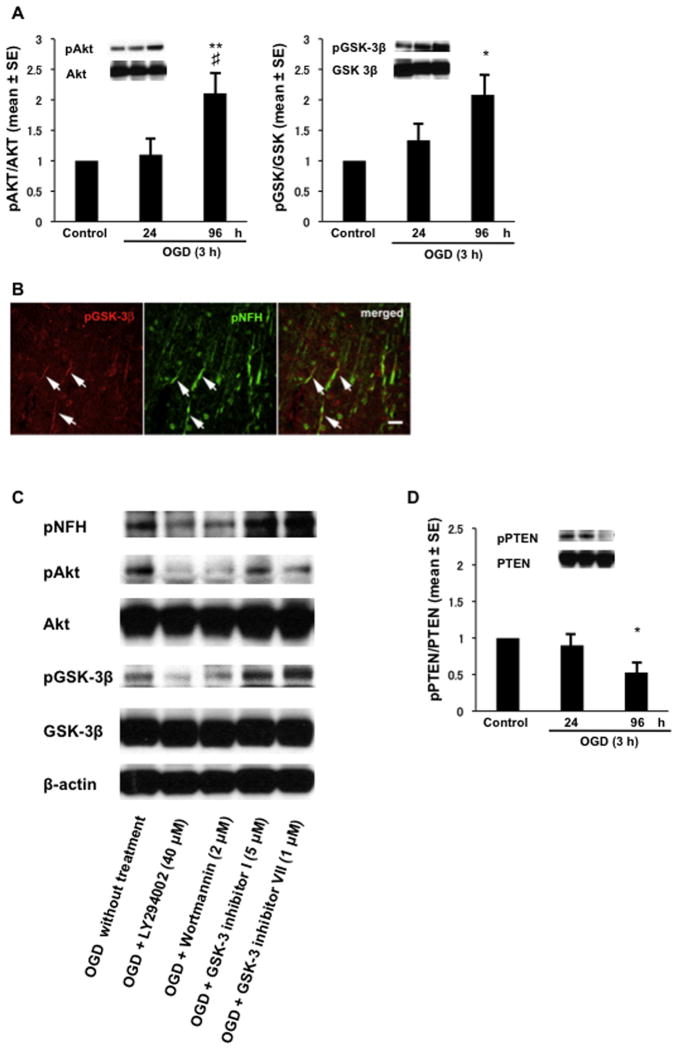
Results: NFH(+) axons and MBP(+) oligodendrocytes substantially increased in the peri-infarct area during stroke recovery, concomitantly with an increase in dendrites and spines identified by Golgi-Cox staining. In vitro, cortical neurons subjected to OGD exhibited significant increases in axonal outgrowth and in phosphorylated NFH protein levels, concurrently with downregulation of phosphatase tensin homolog deleted on chromosome 10, activation of Akt, and inactivation of glycogen synthase kinase-3β in regenerated axons. Blockage of phosphoinositide 3-kinase with pharmacological inhibitors suppressed Akt activation and attenuated phosphorylation of glycogen synthase kinase-3β, which resulted in suppression of phosphorylated NFH and axonal outgrowth after OGD; whereas GSK-3 inhibitors augmented axonal regeneration and elevated phosphorylated NFH levels after OGD.

Conclusions: Stroke induces axonal outgrowth and myelination in rodent ischemic brain during stroke recovery, and the phosphoinositide 3-kinase/Akt/glycogen synthase kinase-3β signaling pathway mediates axonal regeneration of cortical neurons after OGD.


Conflict of interest statement

Conflict of interest: None

Figures

Figure 1
Figure 1. Distribution of pNFH+ and MBP+ fibers in the peri-infarct cortical region
Panel A is images of brain coronal sections stained with H&E from representative rats, showing infarction at 7 days and cavitation at 56 days after MCAO as outlined by a solid line as well as peri-infarct area indicated by a dotted line (300 μm apart from the solid line). Panel B is double immunofluorescent confocal images of representative rats at 7, 28 and 56 days after MCAO, showing pNFH+ and MBP+ fibers as well as pNFH+ fibers and NeuN+ cells. Arrows and arrowheads indicate that pNFH+ axons were not associated and closely associated, respectively, with MBP+ processes in the peri-infarct areas. Panel C is quantitative data of pNFH+ axons in the ipsilateral peri-infarct area. Panel D is quantitative data of pNFH+ axons closely associated with MBP+ processes in the peri-infarct area. N=4/group. Values are mean ± SE. ***P < 0.001 vs sham group; ###P < 0.001 vs the 7 day group; †††P < 0.001 vs the 28 day group. Scale bars: 2 mm in A; 500 μm in A (magnified images); 20 μm in B.
Figure 2
Figure 2. Morphological alteration of dendrites and dendritic spines after MCAO in the rat
Panels A, B, C are microscopic images of cortical pyramidal neurons stained with Golgi-Cox staining from representative rats, showing dendritic and spine morphologies in sham-operated rat (A), rats at 7 (B), and 56 days (C) after MCAO at different magnifications. 50 μm, 20 μm, and 10 μm on each panel C.
Figure 3
Figure 3. Axonal outgrowth and myelination after OGD in primary cortical neuronal cultures
Panels A is representative time-lapse microscopic images of primary cortical neuronal culture in a microfluidic chamber, showing morphological changes of axons before OGD, and at 24 h and at 96 h after OGD. Red arrows indicate damaged axon with a beaded appearance. Panels B is quantitative data of total number of axons before OGD, and at 24 and 96h after OGD. N=4/group. Panel C shows pNFH protein levels measured by Western blots. N=5/group. Panel D is double immunofluorescent confocal images of cocultured primary cortical neurons and differentiated N20.1 cells, showing a pNFH+ axon (red) was spirally wrapped by CNPase process (arrow, green). Values are mean ± SE. **P < 0.01 vs the control; ***P < 0.001 vs the control; ##P < .01 vs the 24 h group; ###P < 0.001 vs the 24 h group. 40 μm and 20 μm on each panel A.
Figure 4
Figure 4. Phosphorylation of PTEN, Akt, and GSK-3β in cortical neurons after OGD
Panels A is Western blot data, showing that pAkt (Ser 473, A), and pGSK-3β (Ser 9, B). Total Akt, and GSK-3β levels were used as internal controls. Panel B is confocal images of double immunofluorescent staining showing that pGSK-3β+ fibers (red) were pNFH+ (green) in peri-infarct area of a representative rat 28 days after stroke. Scale bars: 20 μm. Panel C is representative Western blots showing protein levels of pNFH, pAkt, and pGSK-3β after treatment with PI3K inhibitors, LY294002 (40 μM, LY) and Wortmannin (2 μM, W), or GSK-3 inhibitor I (5 μM, I) or VII (1 μM, VII). Total Akt, GSK-3β and β actin were used as internal controls. Panels D is Western blot data, showing pPTEN (Ser 380/Thr 382/383, C). Total PTEN levels was used as internal controls. N=5/group. Values are mean ± SE. *P < 0.05 vs the control; ** P < 0.01 vs the control; #P < 0.05 vs the 24 h group.
Figure 5
Figure 5. Effects of Akt and GSK-3 inhibitors on axonal elongation and arborization in OGD-challenged primary cortical neurons
Panel A is representative time-lapse microscopic images of primary cortical neuronal culture in a microfluidic chamber, showing axonal outgrowth (lower images, arrowhead) from a starting point at 24 h (upper images, black arrow) to ending point at 48 h (lower images, red arrow) in OGD-challenged neurons without any treatment (left), with LY294002 treatment (middle), or with GSK-3 inhibitor I treatment (right). Panel B is confocal tiling images of pNFH+ axons of primary cortical neurons cultured in microfluidic chambers at 96 h after OGD without treatment (left), LY294002 treatment (middle), or GSK-3 inhibitor I (right). Panel C is quantitative data of axonal elongation after treatment with PI3K inhibitors LY294002 (LY) and Wortmannin (W) or GSK-3 inhibitor I (I) and VII (VII) in OGD challenged neurons. Panel D is quantitative data of percentage of pNFH positive axons that distended from the entrance of axonal compartments (B, dot lines) in at 96 after OGD without treatment, with treatment of LY294002 (LY) or GSK-3 inhibitor I (I). N=3/group. Values are mean ± SE. *P < 0.05 vs the OGD without treatment group; **P < 0.01 vs the OGD without treatment group. Scale bars: 50 μm in A;100 μm in B.

References

    1. Li S, Overman JJ, Katsman D, Kozlov SV, Donnelly CJ, Twiss JL, et al. An age-related sprouting transcriptome provides molecular control of axonal sprouting after stroke. Nat Neurosci. 2010;13:1496–1504. - PMC - PubMed
    1. Liu Z, Li Y, Zhang ZG, Cui X, Cui Y, Lu M, et al. Bone marrow stromal cells enhance inter- and intracortical axonal connections after ischemic stroke in adult rats. J Cereb Blood Flow Metab. 2010;30:1288–1295. - PMC - PubMed
    1. Hirokawa N. Cross-linker system between neurofilaments, microtubules, and membranous organelles in frog axons revealed by the quick-freeze, deep-etching method. J Cell Biol. 1982;94:129–142. - PMC - PubMed
    1. Julien JP, Mushynski WE. Multiple phosphorylation sites in mammalian neurofilament polypeptides. J Biol Chem. 1982;257:10467–10470. - PubMed
    1. de Waegh SM, Lee VM, Brady ST. Local modulation of neurofilament phosphorylation, axonal caliber, and slow axonal transport by myelinating schwann cells. Cell. 1992;68:451–463. - PubMed

Publication types

MeSH terms

Substances