. 2012 Aug;40(15):7269-79.
doi: 10.1093/nar/gks439. Epub 2012 May 22.

Direct comparison of small RNA and transcription factor signaling

Affiliations

Direct comparison of small RNA and transcription factor signaling

Razika Hussein et al. Nucleic Acids Res. 2012 Aug.

Abstract

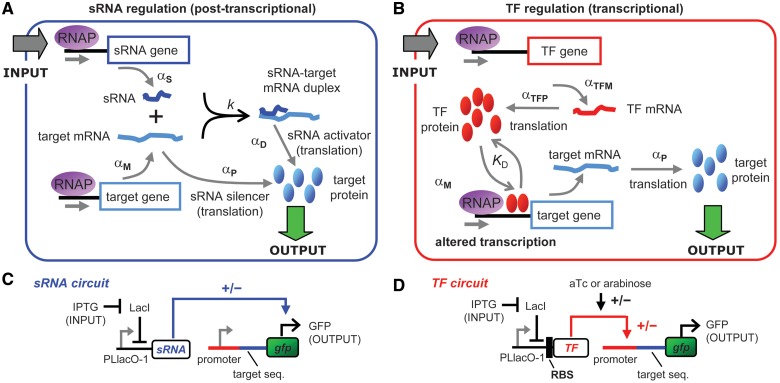
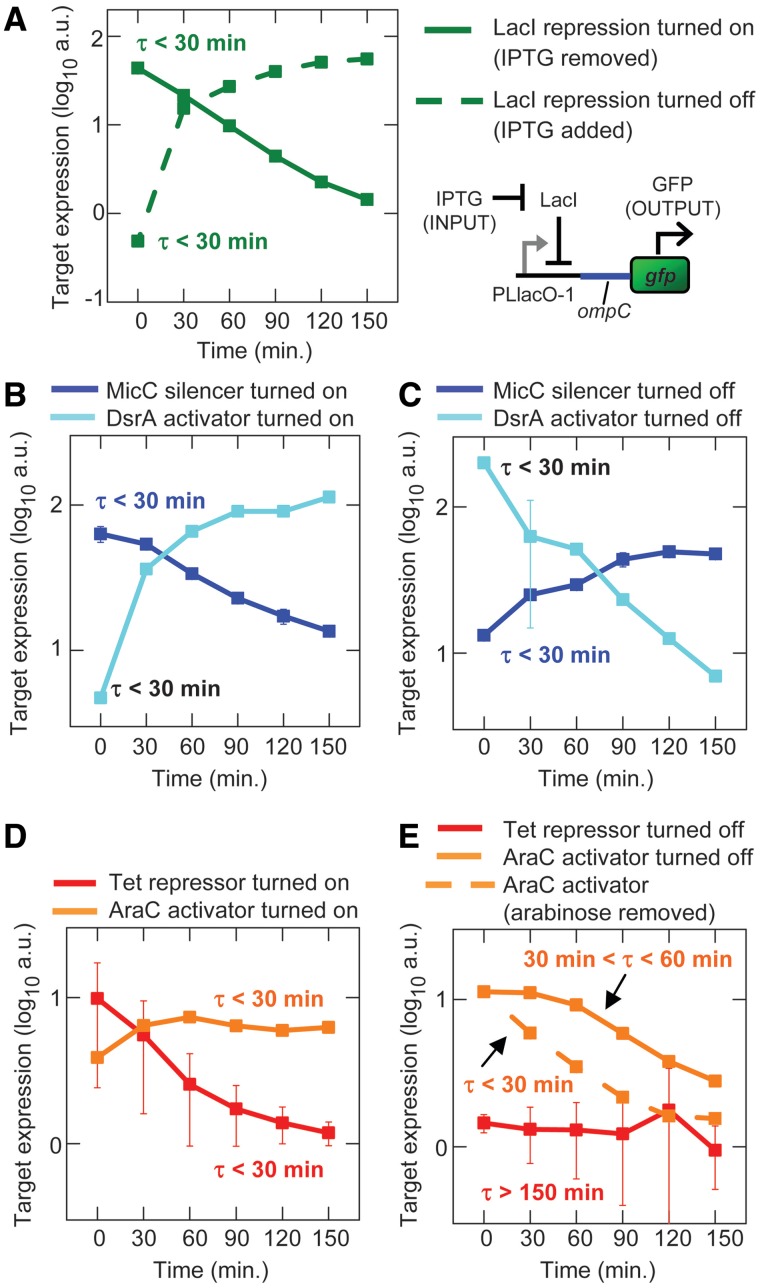
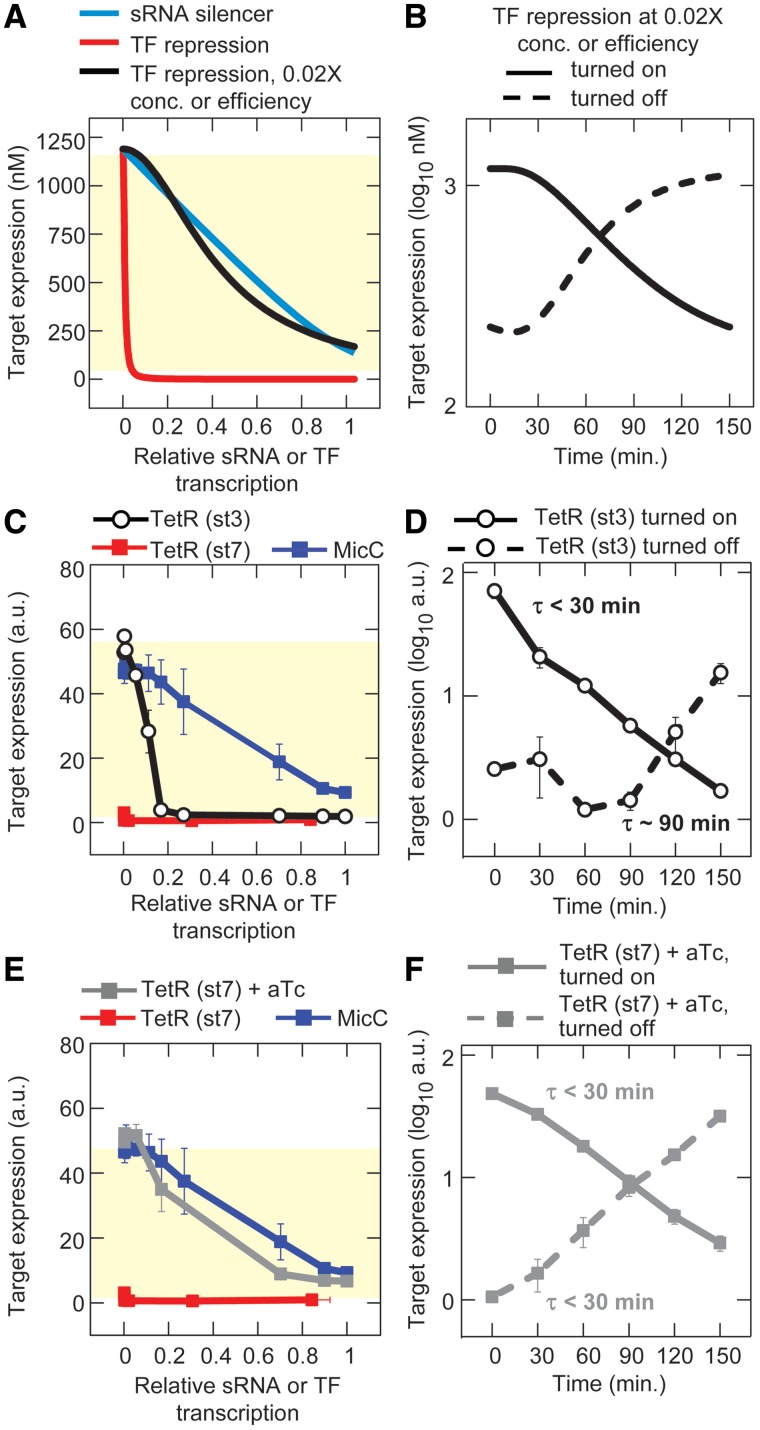
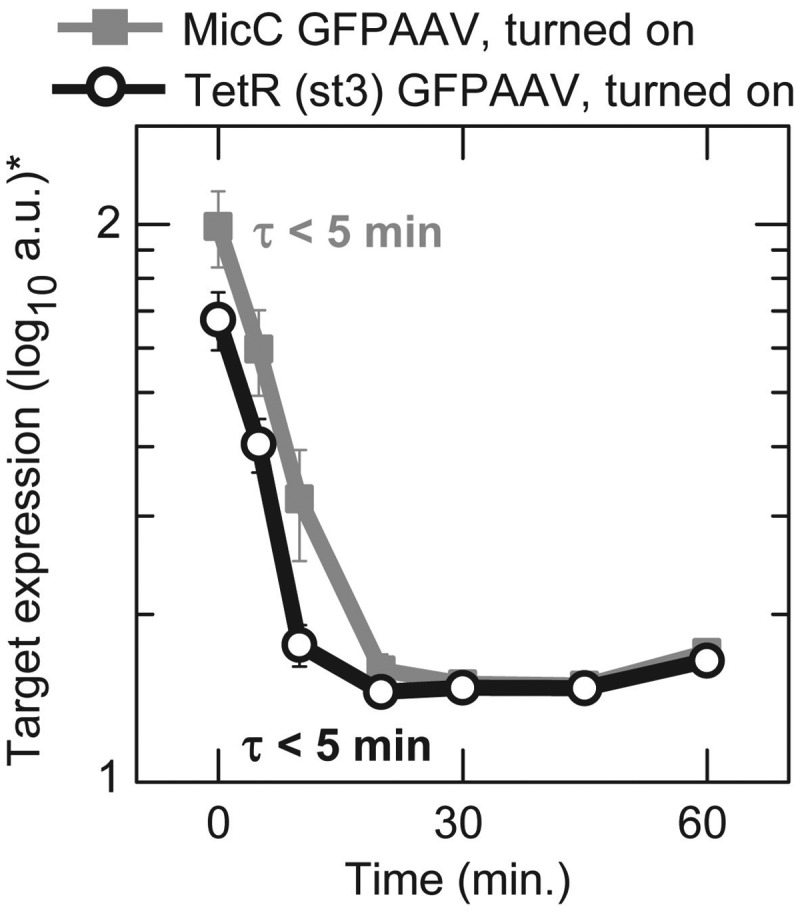
Small RNAs (sRNAs) and proteins acting as transcription factors (TFs) are the principal components of gene networks. These two classes of signaling molecules have distinct mechanisms of action; sRNAs control mRNA translation, whereas TFs control mRNA transcription. Here, we directly compare the properties of sRNA and TF signaling using mathematical models and synthetic gene circuits in Escherichia coli. We show the abilities of sRNAs to act on existing target mRNAs (as opposed to TFs, which alter the production of future target mRNAs) and, without needing to be first translated, have surprisingly little impact on the dynamics. Instead, the dynamics are primarily determined by the clearance rates, steady-state concentrations and response curves of the sRNAs and TFs; these factors determine the time delay before a target gene's expression can maximally respond to changes in sRNA and TF transcription. The findings are broadly applicable to the analysis of signaling in gene networks, and we demonstrate that they can be used to rationally reprogram the dynamics of synthetic circuits.


Figures

Figure 1.
Figure 1.
sRNA and transcription factor (TF) regulation in a simple genetic circuit. (A, B) sRNAs bind to target mRNAs resulting in a duplex which decreases (sRNA silencer) or increases (sRNA activator) mRNA translation. For sRNA silencers, it is the target mRNA that is translated, whereas for sRNA activators, it is the duplex that is translated. TFs bind to sequences at or near the promoter of the target gene to increase or decrease its transcription. αS, αM, αP, αTFM, αTFP, αD, k and KD are rate constants as defined in the main text. Degradation reactions, which are included in the models, are not shown. (C, D) Experimental system for characterizing the response curves and dynamics (see the main text).
Figure 2.
Figure 2.
Theoretical and experimental response curves. Error bars indicate the SEM of duplicate measurements. Yellow shading indicates the approximate bounds of the regulatory region. Transcription rates of the sRNA and TF genes are normalized to the target gene transcription rate which is 1 nM min−1 (which is 0 on the log10 scale) (green line). (A, B) Theoretical response curves with relative sRNA and TF transcription rates from 0.001- to 1000-fold the target mRNA rate. Equations and parameters are listed in the Supplementary Methods and ‘Materials and Methods’ section. (C, D) Linear plot of the data from panels A and B where sRNA and TF transcription is limited to a rate equal to the target gene. (E) Experimental response curve for MicC (sRNA silencer) acting on the ompC target sequence (HL1085). (F) Experimental response curve for tetracycline repressor, TetR (TF repressor) acting at the PLtetO-1 promoter (HL1082). Note: The data were not fitted to a Hill function (see below) because only part of the response curve can be measured due to ‘leaky’ TetR. (G) Experimental response curve for DsrA (sRNA activator) acting on the rpoS target sequence (HL1299). (H) Experimental response curves for AraC (TF activator) acting on the Plar promoter in the presence of 10 mM l-arabinose with either the rpoS target sequence in a ΔdsrA background [plus constitutive transcription of DsrA under the control of PLtetO-1 (HL1449)] or the ompC target sequence in a ΔmicC background (HL1289). Data were fitted to a Hill-type function formula image
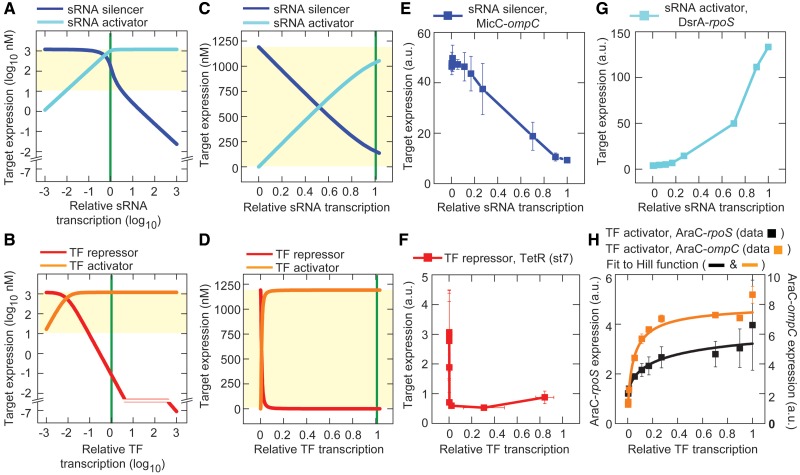
, where α is the maximum expression due to induction (units: fluorescence, a.u.), TF* is the TF transcription rate which is presumed to be proportional to the TF concentration (units: relative transcription, a.u.), K is the TF transcription rate that results in half the maximal level of induced expression (units: relative transcription, a.u.), n is the Hill coefficient (unitless) and c is the level of expression before IPTG is added (units: fluorescence, a.u.). The fit values for AraC-rpoS are: R2 = 0.98, reduced χ2 = 44.9, α = 3.43 ± 0.61 a.u., K = 0.34 ± 0.17 a.u., n = 0.57 ± 0.10, c = 0.99 ± 0.08 a.u. The fit values for AraC-ompC are: R2 > 0.99, reduced χ2 = 3.24, α = 7.47 ± 0.46 a.u., K = 0.05 ± 0.004 a.u., n = 0.81 ± 0.08, c = 0.55 ± 0.21 a.u.
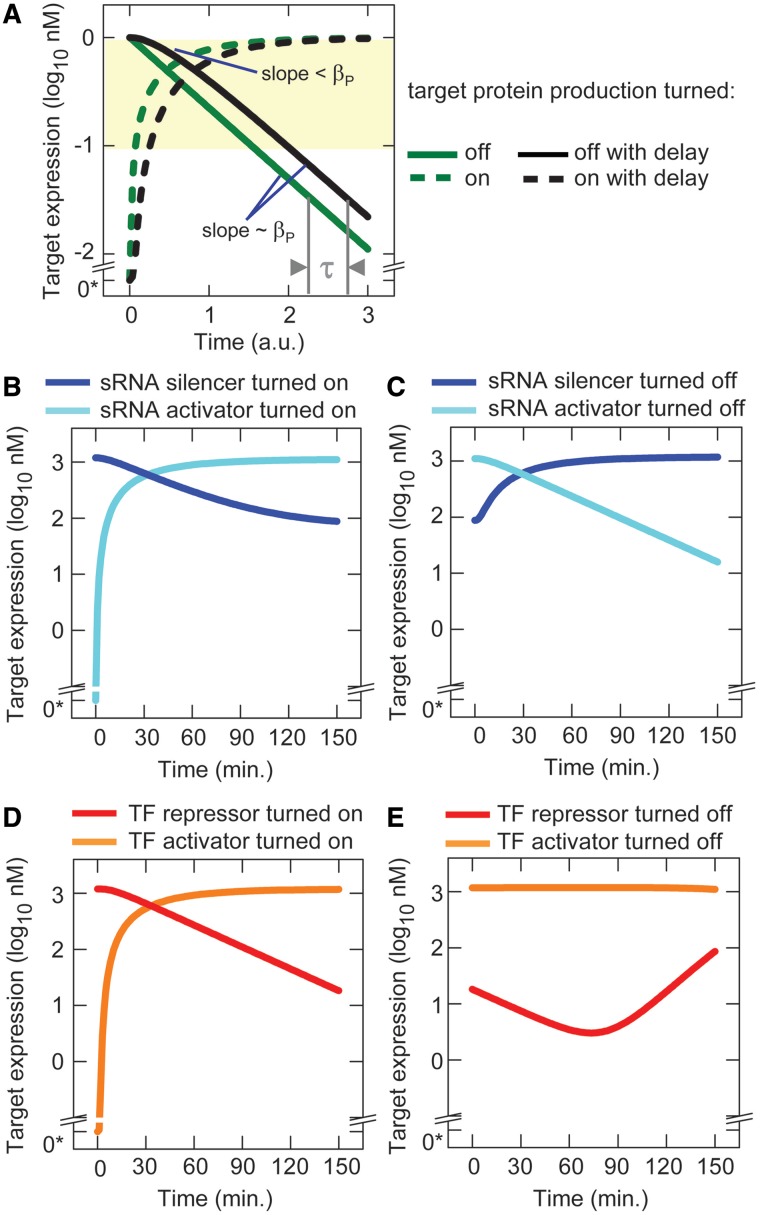
Figure 3.
Figure 3.
Predicted dynamics of sRNA and TF regulation. (A) Target protein concentration as a function of time with and without the delay due to the target mRNA or duplex taking time to reach steady state (Equation 1). Parameter values were chosen to best illustrate the effect of the degradation rate on the dynamics and the time delay (values are not necessarily those used in the model). For turning on transcription with no delay, the parameters values are: αP = proteins nM (mRNA nM)−1 min−1, βP = 0.05 min−1, P[0] = 0 nM, [Y] = 1 nM with [Y] reaching steady state immediately. For turning off transcription with no delay, the parameters values are the same except that [Y] = 0 nM and P[0] = 1 nM. Simulations with the delay are identical except that [Y] does not reach steady state immediately but approaches its steady state according to the same function and with the same parameter values as [P]. 0* indicates an actual value of zero not 100. (B–E) Simulated dynamics following the turning on or off of sRNA and TF transcription (parameters are listed in ‘Materials and Methods’ section).
Figure 4.
Figure 4.
Experimental dynamics following the turning on or off of sRNA and TF transcription. The sRNAs are MicC and DsrA, and the TFs are TetR (st7) and AraC. Strains are the same as used in Figure 2. sRNAs and TFs are turned on and off by the addition or removal of IPTG from the media. Error bars are the SEM of duplicate measurements. (A) The direct turning on and off of target gene transcription without sRNA and TF regulation (HL1178). (B) sRNA transcription turned on. (C) sRNA transcription turned off. (D) TF transcription turned on. (E) TF transcription turned off.
Figure 5.
Figure 5.
Reprogramming response curves and dynamics. Errors bars indicate the SEM of duplicate measurements. (A) Theoretical response curves for the TF repressor with decreased translational efficiency or decreased binding affinity (note: the two curves are identical and overlay each other). sRNA silencer and TF repression curves from Figure 2C and D are shown for comparison. (B) Theoretical dynamics for TF repression with decreased translation or decreased binding affinity. (C, D) Experimental response curve and dynamics with decreased translation of the TF repressor (TetR). The highly efficient RBS (st7) was replaced with the less-efficient RBS (st3) (HL1176). Response curves for MicC and TetR (st7) from Figure 2E and F are shown for comparison. (E, F) Experimental response curve and dynamics with decreased binding affinity of the TF repressor (TetR). The binding affinity of TetR (st7) was reduced by adding 1 µM aTc to the media (HL1082). Response curves for MicC and TetR (st7) without aTc from Figure 2E and F are shown for comparison.
Figure 6.
Figure 6.
Dynamics with GFPAAV following the turning on or of sRNA silencer (MicC) and TF repressor [TetR (st3)] transcription. *The PMT voltage for these flow cytometry measurements was increased to compensate for low-GFP concentrations; therefore, values in the plot should not be compared to values in other experiments. Strains are HL4870 (MicC-GFPAAV) and HL4872 (TetR (st3) GFPAAV).

References

    1. Vogel J, Luisi BF. Hfq and its constellation of RNA. Nat. Rev. Microbiol. 2011;9:578–589. - PMC - PubMed
    1. Repoila F, Darfeuille F. Small regulatory non-coding RNAs in bacteria: physiology and mechanistic aspects. Biol. Cell. 2009;101:117–131. - PubMed
    1. Modi SR, Camacho DM, Kohanski MA, Walker GC, Collins JJ. Functional characterization of bacterial sRNAs using a network biology approach. Proc. Natl Acad. Sci. USA. 2011;108:15522–15527. - PMC - PubMed
    1. Mehta P, Goyal S, Wingreen NS. A quantitative comparison of sRNA-based and protein-based gene regulation. Mol. Syst. Biol. 2008;4:221. - PMC - PubMed
    1. Shimoni Y, Friedlander G, Hetzroni G, Niv G, Altuvia S, Biham O, Margalit H. Regulation of gene expression by small non-coding RNAs: a quantitative view. Mol. Syst. Biol. 2007;3:138. - PMC - PubMed

Publication types

Substances