

A novel FADS1 isoform potentiates FADS2-mediated production of eicosanoid precursor fatty acids
- PMID: 22619218
- PMCID: PMC3540860
- DOI: 10.1194/jlr.M025312
A novel FADS1 isoform potentiates FADS2-mediated production of eicosanoid precursor fatty acids
Abstract
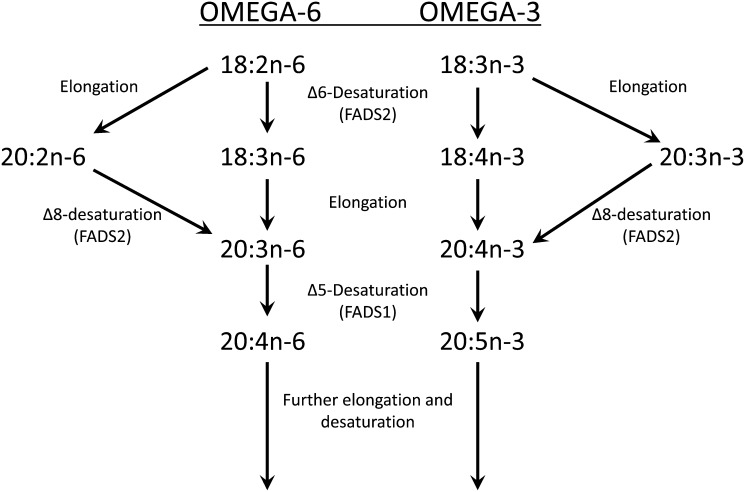
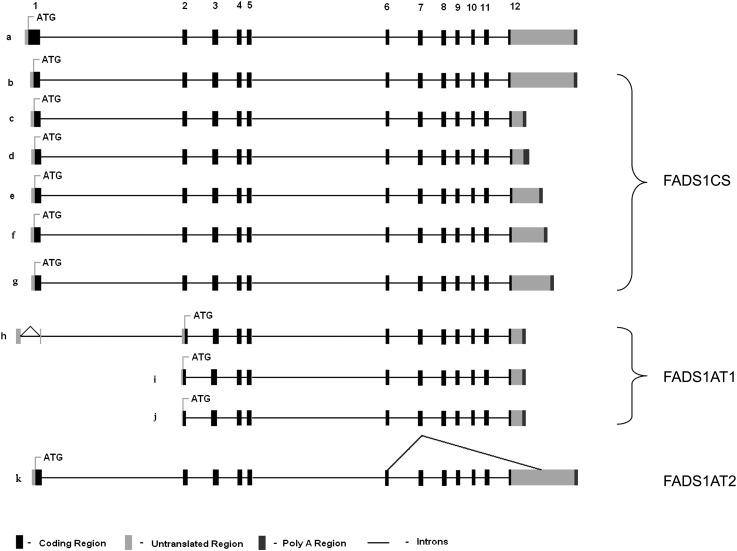
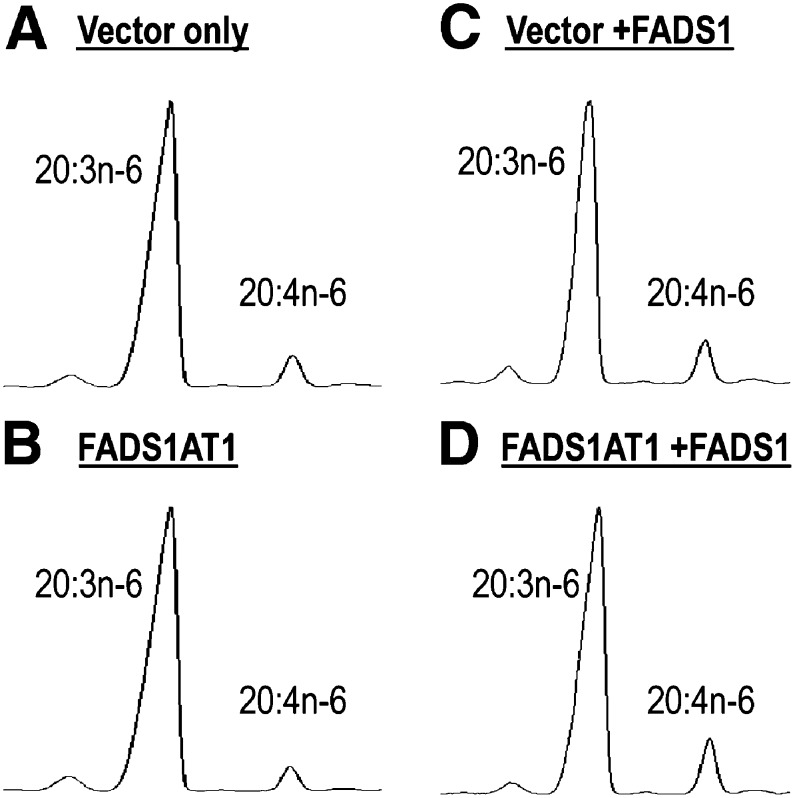
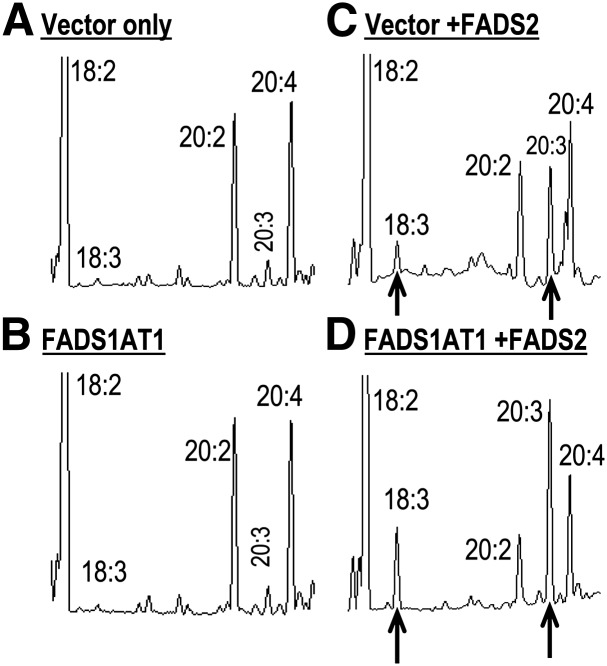
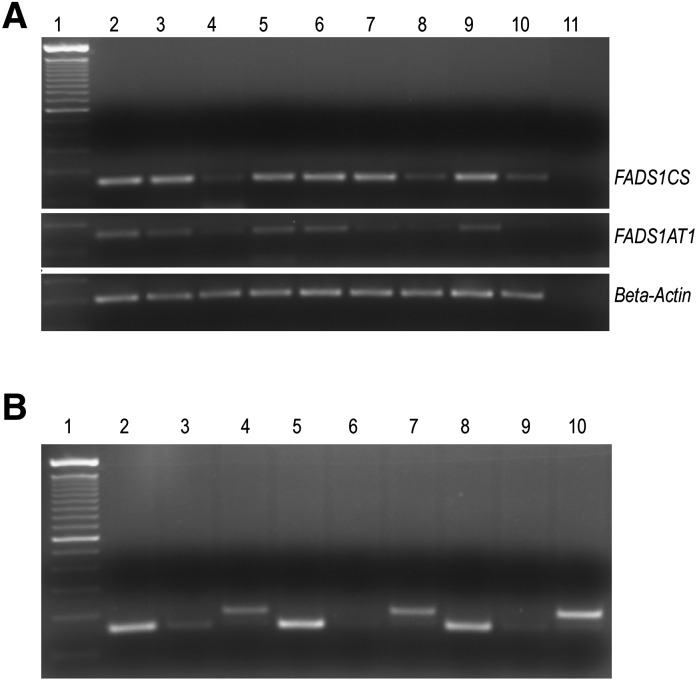
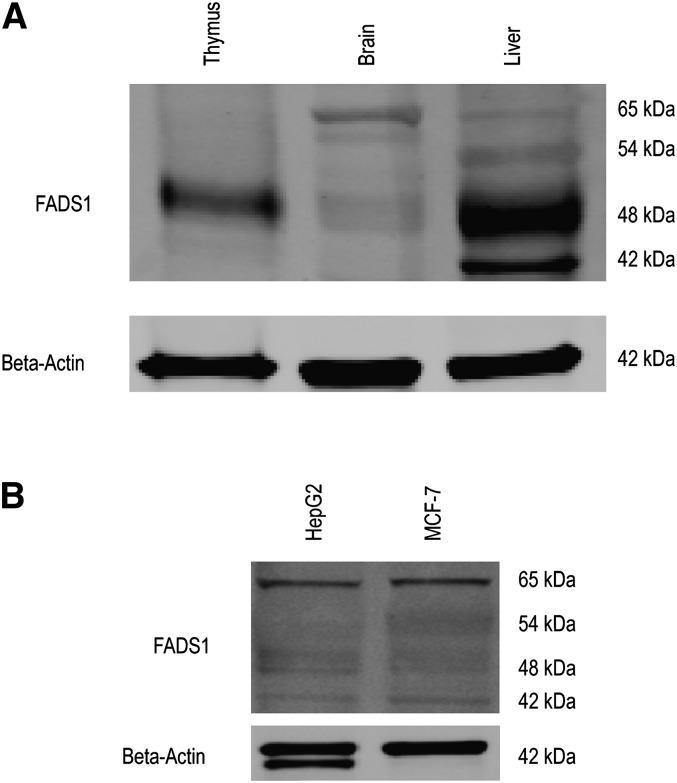
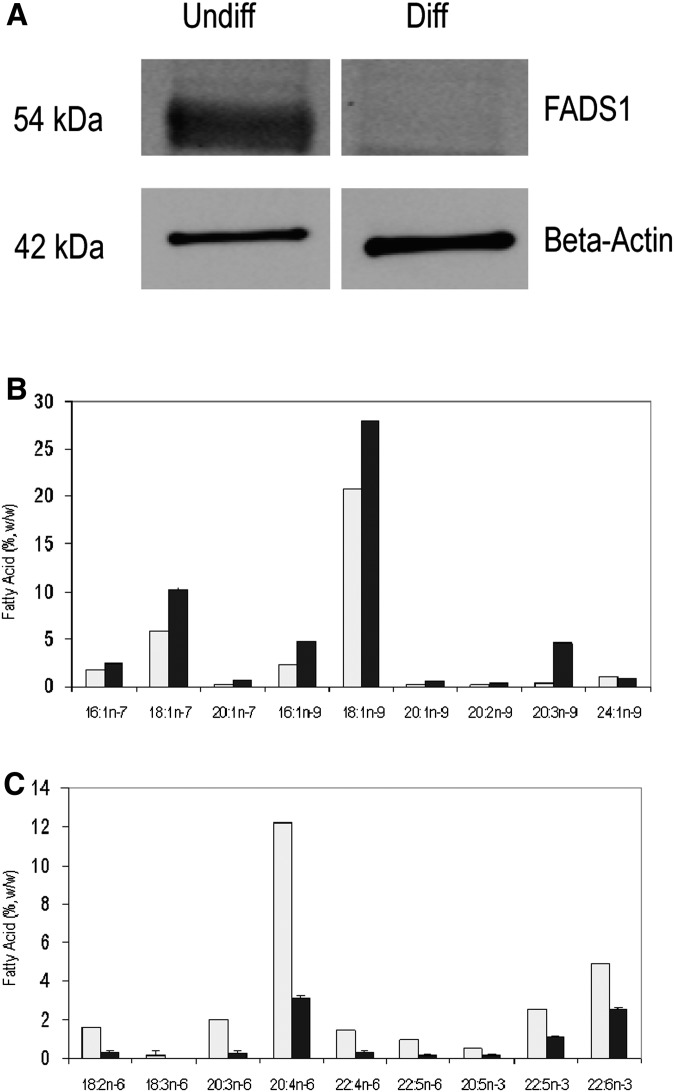
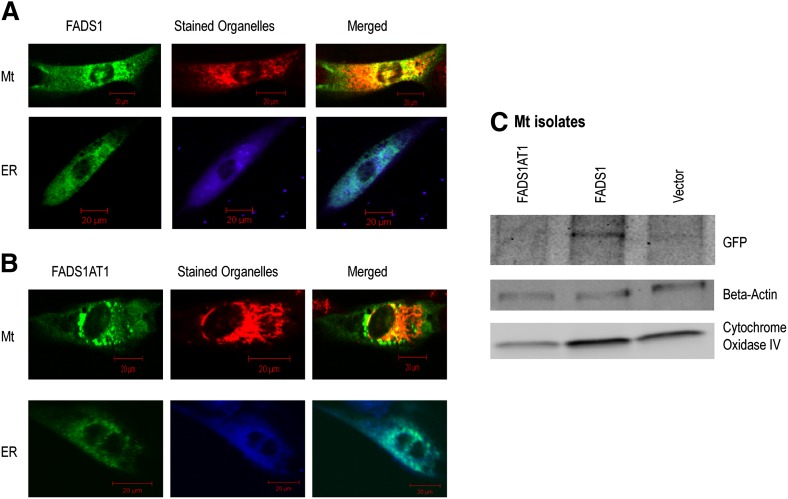
The fatty acid desaturase (FADS) genes code for the rate-limiting enzymes required for the biosynthesis of long-chain polyunsaturated fatty acids (LCPUFA). Here we report discovery and function of a novel FADS1 splice variant. FADS1 alternative transcript 1 (FADS1AT1) enhances desaturation of FADS2, leading to increased production of eicosanoid precursors, the first case of an isoform modulating the enzymatic activity encoded by another gene. Multiple protein isoforms were detected in primate liver, thymus, and brain. In human neuronal cells, their expression patterns are modulated by differentiation and result in alteration of cellular fatty acids. FADS1, but not FADS1AT1, localizes to endoplasmic reticulum and mitochondria. Ribosomal footprinting demonstrates that all three FADS genes are translated at similar levels. The noncatalytic regulation of FADS2 desaturation by FADS1AT1 is a novel, plausible mechanism by which several phylogenetically conserved FADS isoforms may regulate LCPUFA biosynthesis in a manner specific to tissue, organelle, and developmental stage.
Figures
Similar articles
-
Dietary long-chain polyunsaturated fatty acids upregulate expression of FADS3 transcripts.Prostaglandins Leukot Essent Fatty Acids. 2013 Jan;88(1):15-9. doi: 10.1016/j.plefa.2012.02.003. Epub 2012 Mar 6. Prostaglandins Leukot Essent Fatty Acids. 2013. PMID: 22398025 Free PMC article.
-
A novel FADS2 isoform identified in human milk fat globule suppresses FADS2 mediated Δ6-desaturation of omega-3 fatty acids.Prostaglandins Leukot Essent Fatty Acids. 2018 Nov;138:52-59. doi: 10.1016/j.plefa.2018.06.004. Epub 2018 Jun 28. Prostaglandins Leukot Essent Fatty Acids. 2018. PMID: 30041907 Free PMC article.
-
Novel fatty acid desaturase 3 (FADS3) transcripts generated by alternative splicing.Gene. 2009 Oct 1;446(1):28-34. doi: 10.1016/j.gene.2009.06.016. Epub 2009 Jun 30. Gene. 2009. PMID: 19573581 Free PMC article.
-
Fatty Acid Desaturase 3 (Fads3) is a singular member of the Fads cluster.Biochimie. 2011 Jan;93(1):87-90. doi: 10.1016/j.biochi.2010.03.002. Epub 2010 Mar 11. Biochimie. 2011. PMID: 20226833 Review.
-
Desaturase and elongase-limiting endogenous long-chain polyunsaturated fatty acid biosynthesis.Curr Opin Clin Nutr Metab Care. 2016 Mar;19(2):103-10. doi: 10.1097/MCO.0000000000000254. Curr Opin Clin Nutr Metab Care. 2016. PMID: 26828581 Free PMC article. Review.
Cited by
-
Review of Eukaryote Cellular Membrane Lipid Composition, with Special Attention to the Fatty Acids.Int J Mol Sci. 2023 Oct 28;24(21):15693. doi: 10.3390/ijms242115693. Int J Mol Sci. 2023. PMID: 37958678 Free PMC article. Review.
-
Alternative splicing generates novel Fads3 transcript in mice.Mol Biol Rep. 2016 Aug;43(8):761-766. doi: 10.1007/s11033-016-4018-7. Epub 2016 May 23. Mol Biol Rep. 2016. PMID: 27216536 Free PMC article.
-
Comparison of overfed Xupu and Landes geese in performance, fatty acid composition, enzymes and gene expression related to lipid metabolism.Asian-Australas J Anim Sci. 2020 Dec;33(12):1957-1964. doi: 10.5713/ajas.19.0842. Epub 2020 Jan 13. Asian-Australas J Anim Sci. 2020. PMID: 32054153 Free PMC article.
-
Brown but not white adipose cells synthesize omega-3 docosahexaenoic acid in culture.Prostaglandins Leukot Essent Fatty Acids. 2016 Jan;104:19-24. doi: 10.1016/j.plefa.2015.11.001. Epub 2015 Nov 28. Prostaglandins Leukot Essent Fatty Acids. 2016. PMID: 26802938 Free PMC article.
-
Palmitic acid (16:0) competes with omega-6 linoleic and omega-3 ɑ-linolenic acids for FADS2 mediated Δ6-desaturation.Biochim Biophys Acta. 2016 Feb;1861(2):91-97. doi: 10.1016/j.bbalip.2015.11.007. Epub 2015 Nov 17. Biochim Biophys Acta. 2016. PMID: 26597785 Free PMC article.
References
-
- Dennehey B. K., Leinwand L. A., Krauter K. S. 2006. Diversity in transcriptional start site selection and alternative splicing affects the 5′-UTR of mouse striated muscle myosin transcripts. J. Muscle Res. Cell Motil. 27: 559–575 - PubMed
-
- Lutz C. S. 2008. Alternative polyadenylation: a twist on mRNA 3′ end formation. ACS Chem. Biol. 3: 609–617 - PubMed
Publication types
MeSH terms
Substances
Grants and funding
LinkOut - more resources
Full Text Sources
Molecular Biology Databases
