

Adenylyl cyclase 2 selectively couples to E prostanoid type 2 receptors, whereas adenylyl cyclase 3 is not receptor-regulated in airway smooth muscle
- PMID: 22619251
- PMCID: PMC3400804
- DOI: 10.1124/jpet.112.193425
Adenylyl cyclase 2 selectively couples to E prostanoid type 2 receptors, whereas adenylyl cyclase 3 is not receptor-regulated in airway smooth muscle
Abstract
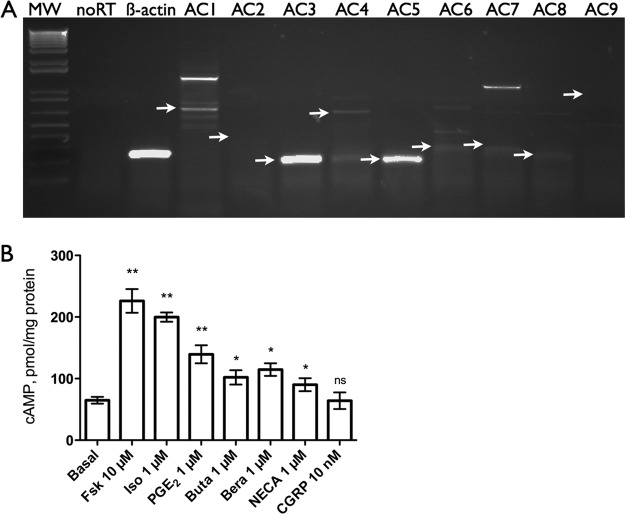
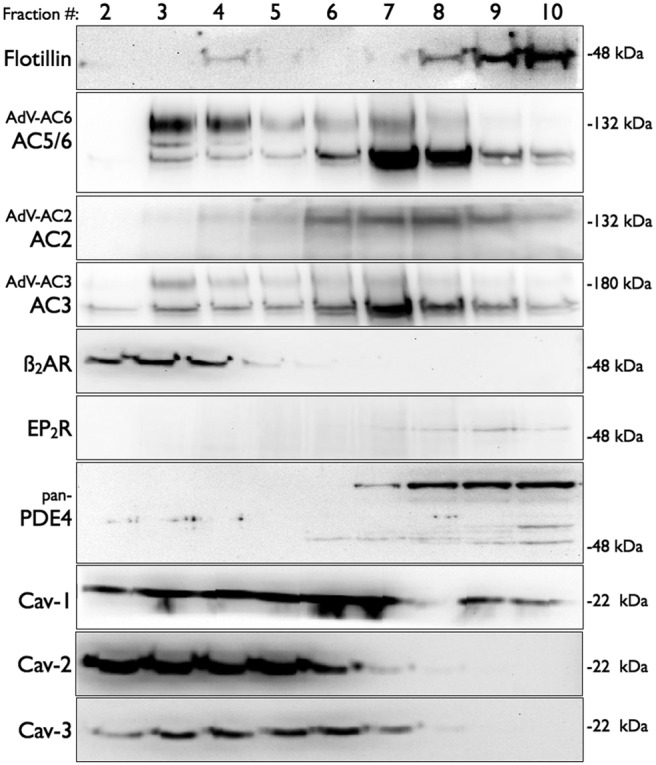
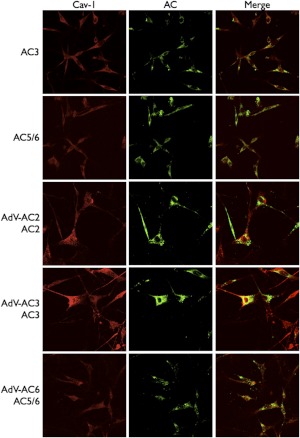
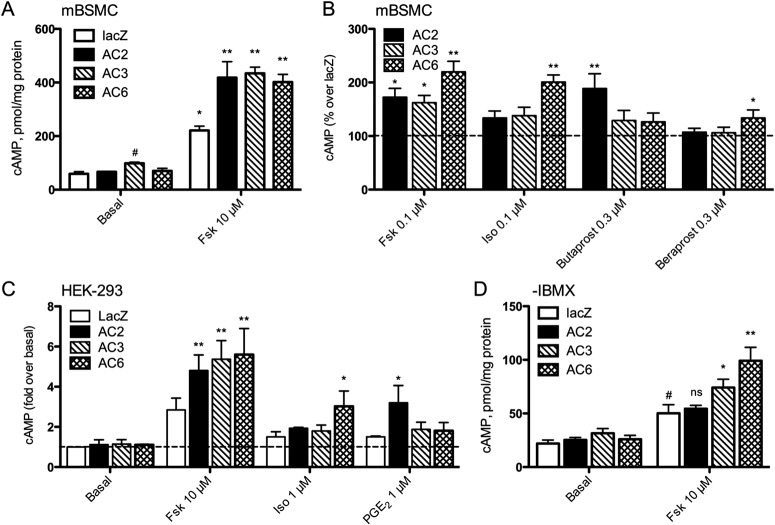
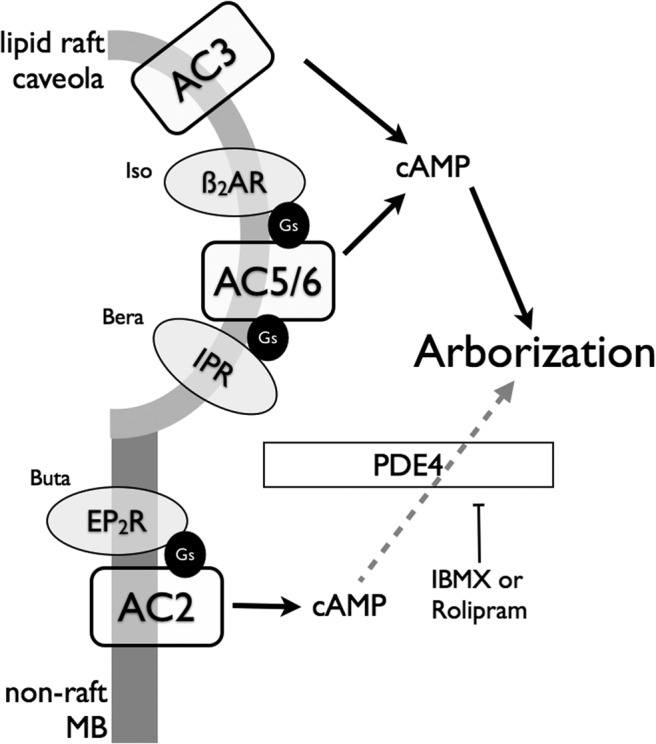
Adenylyl cyclases (ACs) are important regulators of airway smooth muscle function, because β-adrenergic receptor (βAR) agonists stimulate AC activity and cAMP production. We have previously shown in a number of cell types that AC6 selectively couples to βAR and these proteins are coexpressed in lipid rafts. We overexpressed AC2, AC3, and AC6 in mouse bronchial smooth muscle cells (mBSMCs) and human embryonic kidney (HEK)-293 cells by using recombinant adenoviruses and assessed their localization and regulation by various G protein-coupled receptors (GPCRs). AC3 and AC6 were expressed primarily in caveolin-rich fractions, whereas AC2 expression was excluded from these domains. AC6 expression enhanced cAMP production in response to isoproterenol but did not increase responses to butaprost, reflecting the colocalization of AC6 with β(2)AR but not E prostanoid type 2 receptor (EP(2)R) in lipid raft fractions. AC2 expression enhanced butaprost-stimulated cAMP production but had no effect on the β(2)AR-mediated response. AC3 did not couple to any GPCR tested. Forskolin-induced arborization of mBSMCs was assessed as a functional readout of cAMP signaling. Arborization was enhanced by overexpression of AC6 and AC3, but AC2 had no effect. GPCR-stimulated arborization mirrored the selective coupling observed for cAMP production. With the addition of the phosphodiesterase 4 (PDE4) inhibitor rolipram AC2 accelerated forskolin-stimulated arborization. Thus, AC2 selectively couples to EP(2)R, but signals from this complex are limited by PDE4 activity. AC3 does not seem to couple to GPCR in either mBSMCs or HEK-293 cells, so it probably exists in a distinct signaling domain in these cells.
Figures

Similar articles
-
cAMP Signaling Compartmentation: Adenylyl Cyclases as Anchors of Dynamic Signaling Complexes.Mol Pharmacol. 2018 Apr;93(4):270-276. doi: 10.1124/mol.117.110825. Epub 2017 Dec 7. Mol Pharmacol. 2018. PMID: 29217670 Free PMC article. Review.
-
PDE8 Is Expressed in Human Airway Smooth Muscle and Selectively Regulates cAMP Signaling by β2-Adrenergic Receptors and Adenylyl Cyclase 6.Am J Respir Cell Mol Biol. 2018 Apr;58(4):530-541. doi: 10.1165/rcmb.2017-0294OC. Am J Respir Cell Mol Biol. 2018. PMID: 29262264 Free PMC article.
-
Human bronchial smooth muscle cells express adenylyl cyclase isoforms 2, 4, and 6 in distinct membrane microdomains.J Pharmacol Exp Ther. 2011 Apr;337(1):209-17. doi: 10.1124/jpet.110.177923. Epub 2011 Jan 12. J Pharmacol Exp Ther. 2011. PMID: 21228062 Free PMC article.
-
Localization of adenylyl cyclase isoforms and G protein-coupled receptors in vascular smooth muscle cells: expression in caveolin-rich and noncaveolin domains.Mol Pharmacol. 2002 Nov;62(5):983-92. doi: 10.1124/mol.62.5.983. Mol Pharmacol. 2002. PMID: 12391260
-
Forskolin as a tool for examining adenylyl cyclase expression, regulation, and G protein signaling.Cell Mol Neurobiol. 2003 Jun;23(3):305-14. doi: 10.1023/a:1023684503883. Cell Mol Neurobiol. 2003. PMID: 12825829 Free PMC article. Review.
Cited by
-
Effect of Adenylyl Cyclase Type 6 on Localized Production of cAMP by β-2 Adrenoceptors in Human Airway Smooth-Muscle Cells.J Pharmacol Exp Ther. 2019 Jul;370(1):104-110. doi: 10.1124/jpet.119.256594. Epub 2019 May 8. J Pharmacol Exp Ther. 2019. PMID: 31068382 Free PMC article.
-
Development of a high-throughput screening paradigm for the discovery of small-molecule modulators of adenylyl cyclase: identification of an adenylyl cyclase 2 inhibitor.J Pharmacol Exp Ther. 2013 Nov;347(2):276-87. doi: 10.1124/jpet.113.207449. Epub 2013 Sep 5. J Pharmacol Exp Ther. 2013. PMID: 24008337 Free PMC article.
-
International Union of Basic and Clinical Pharmacology. CI. Structures and Small Molecule Modulators of Mammalian Adenylyl Cyclases.Pharmacol Rev. 2017 Apr;69(2):93-139. doi: 10.1124/pr.116.013078. Pharmacol Rev. 2017. PMID: 28255005 Free PMC article. Review.
-
Cross-Talk Between the Adenylyl Cyclase/cAMP Pathway and Ca2+ Homeostasis.Rev Physiol Biochem Pharmacol. 2021;179:73-116. doi: 10.1007/112_2020_55. Rev Physiol Biochem Pharmacol. 2021. PMID: 33398503 Review.
-
cAMP Signaling Compartmentation: Adenylyl Cyclases as Anchors of Dynamic Signaling Complexes.Mol Pharmacol. 2018 Apr;93(4):270-276. doi: 10.1124/mol.117.110825. Epub 2017 Dec 7. Mol Pharmacol. 2018. PMID: 29217670 Free PMC article. Review.
References
-
- Abrahamsen H, Baillie G, Ngai J, Vang T, Nika K, Ruppelt A, Mustelin T, Zaccolo M, Houslay M, Taskén K. (2004) TCR- and CD28-mediated recruitment of phosphodiesterase 4 to lipid rafts potentiates TCR signaling. J Immunol 173:4847–4858 - PubMed
-
- Anderson RG. (1998) The caveolae membrane system.Annu Rev Biochem 67:199–225 - PubMed
-
- Billington CK, Hall IP, Mundell SJ, Parent JL, Panettieri RA, Jr, Benovic JL, Penn RB. (1999) Inflammatory and contractile agents sensitize specific adenylyl cyclase isoforms in human airway smooth muscle. Am J Respir Cell Mol Biol 21:597–606 - PubMed
Publication types
MeSH terms
Substances
Grants and funding
LinkOut - more resources
Full Text Sources
Molecular Biology Databases
Research Materials
Miscellaneous
