. 2012 Jun 19;109(25):E1667-75.
doi: 10.1073/pnas.1201147109. Epub 2012 May 22.

Spike timing plays a key role in synapse elimination at the neuromuscular junction

Affiliations

Spike timing plays a key role in synapse elimination at the neuromuscular junction

Morgana Favero et al. Proc Natl Acad Sci U S A. .

Abstract

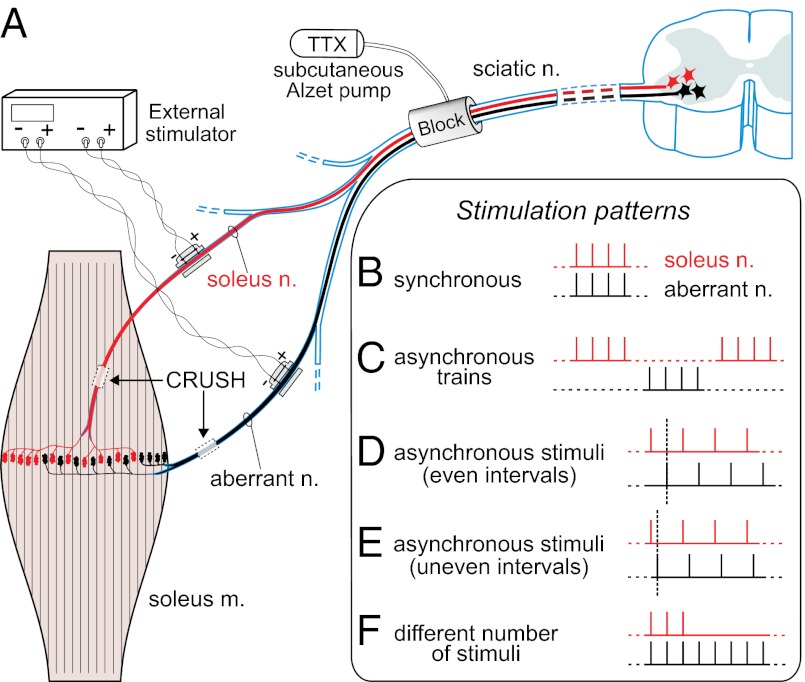
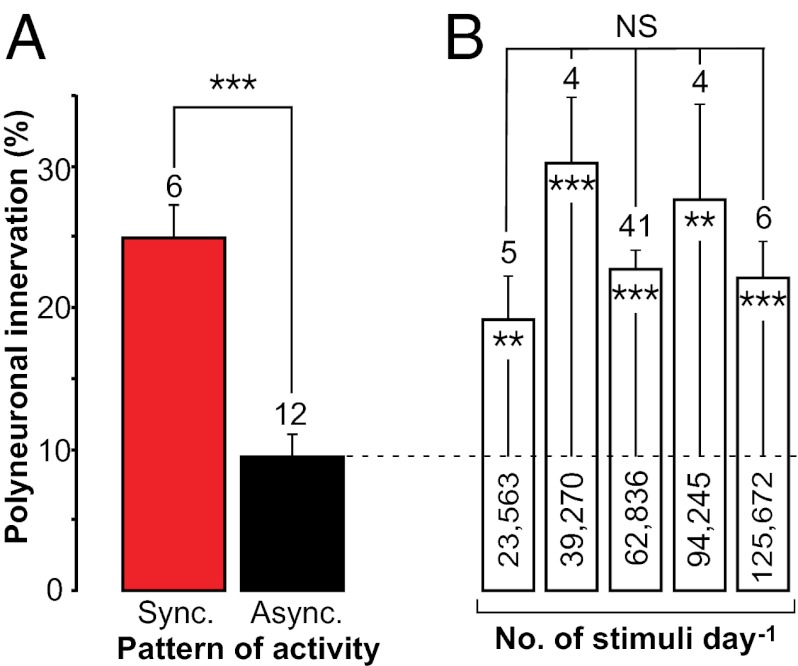
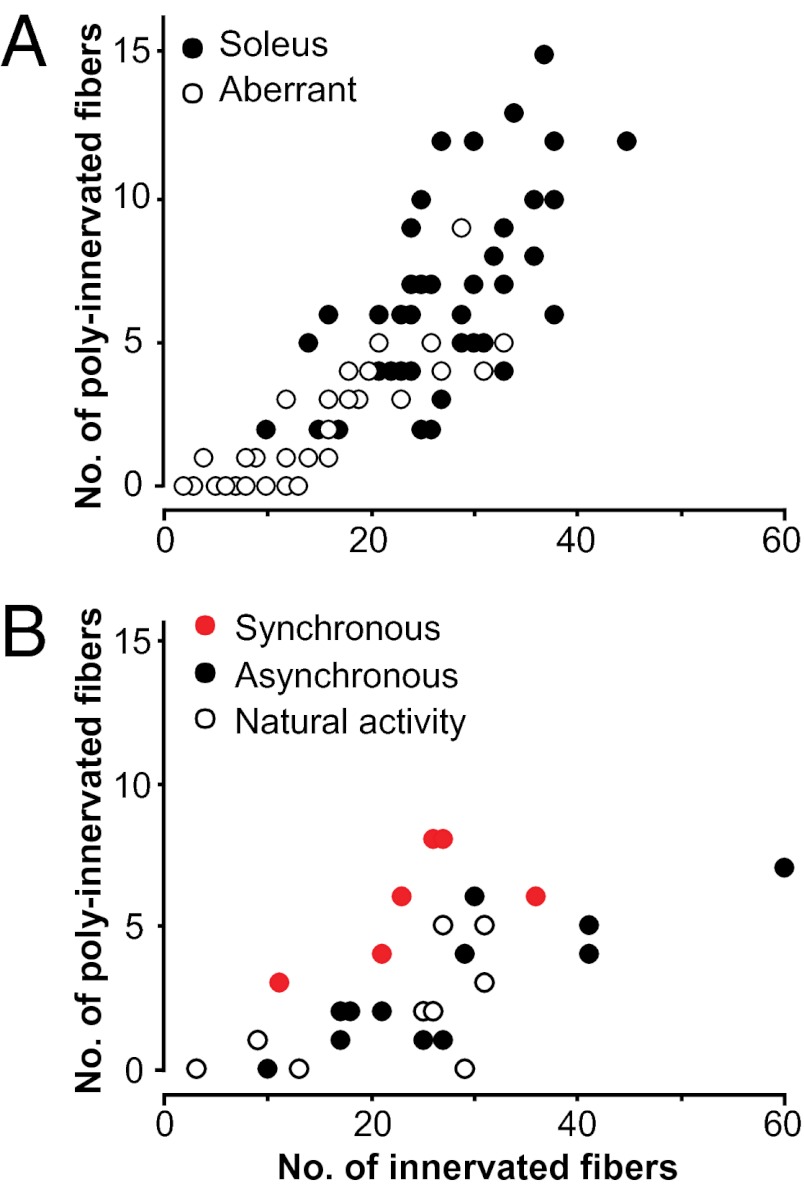
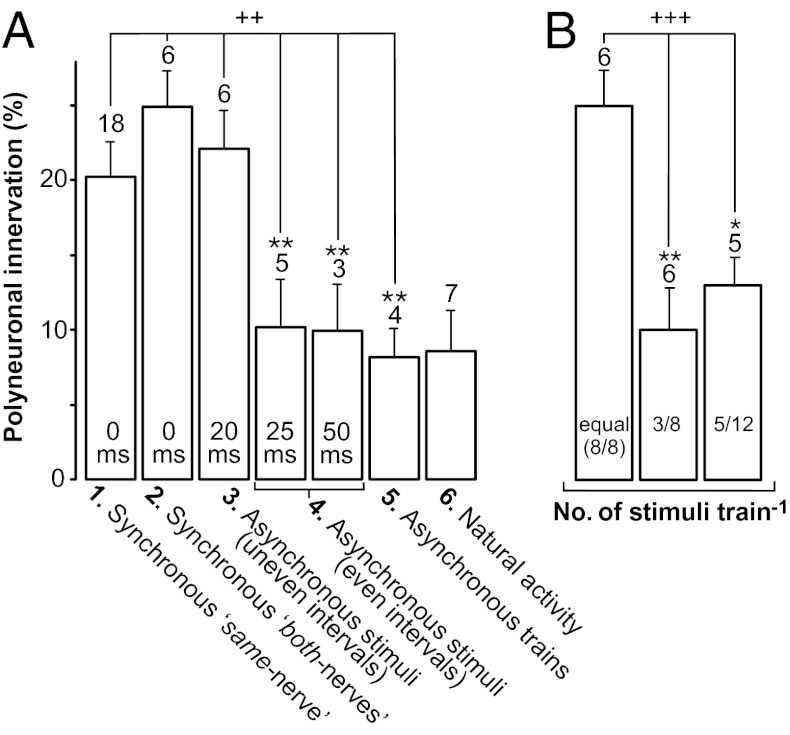
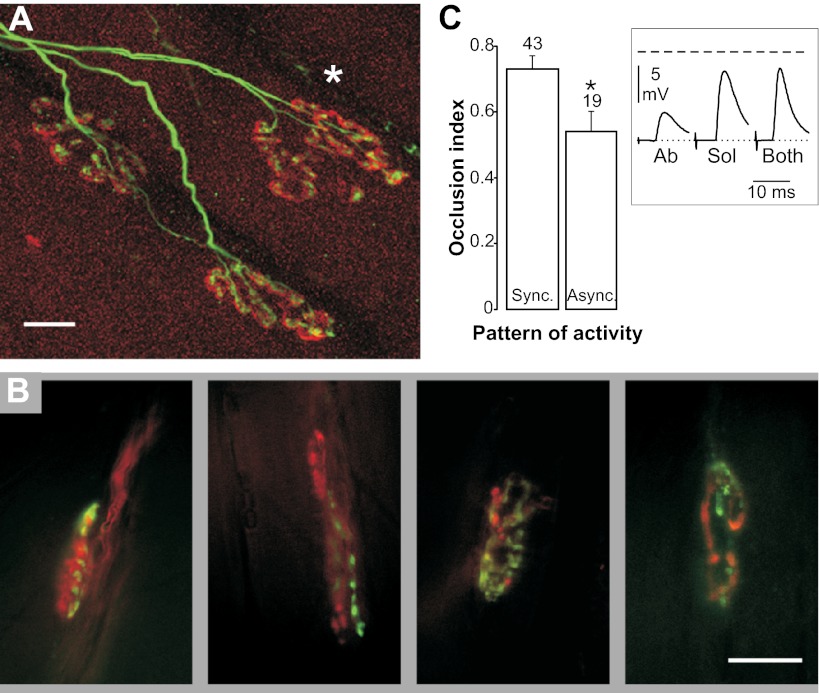
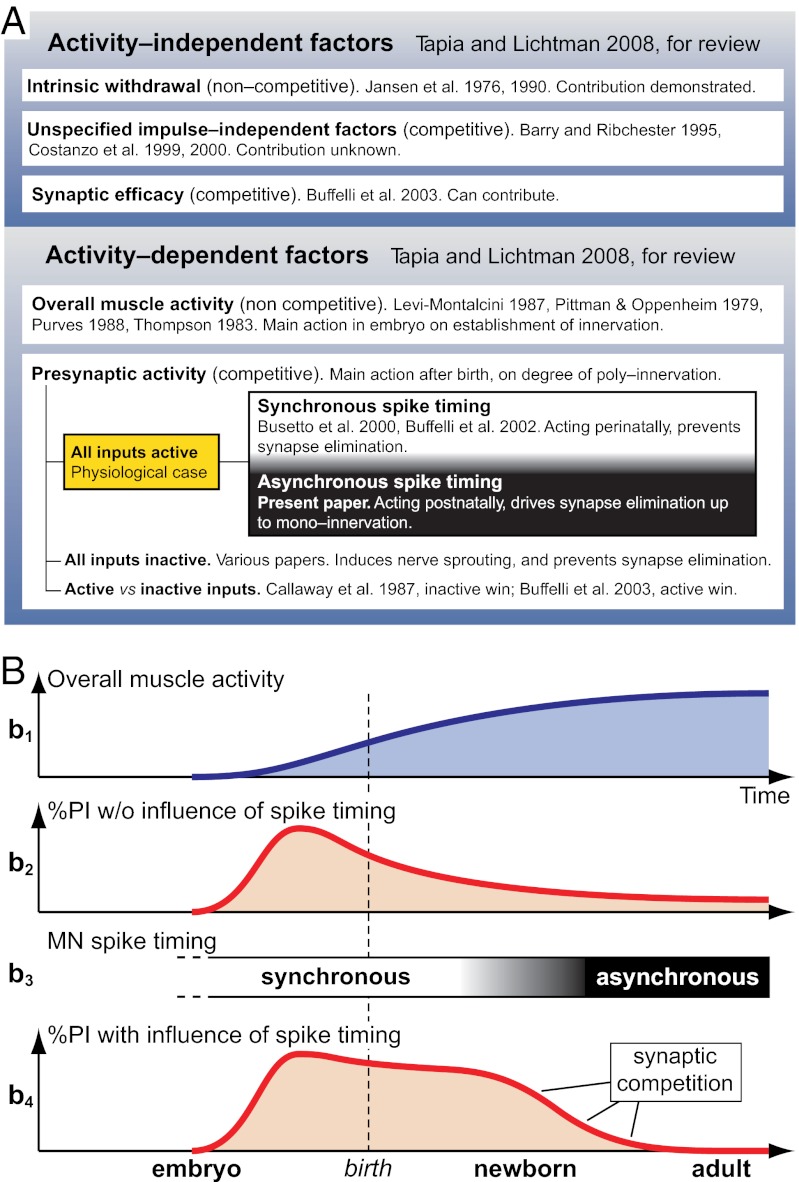
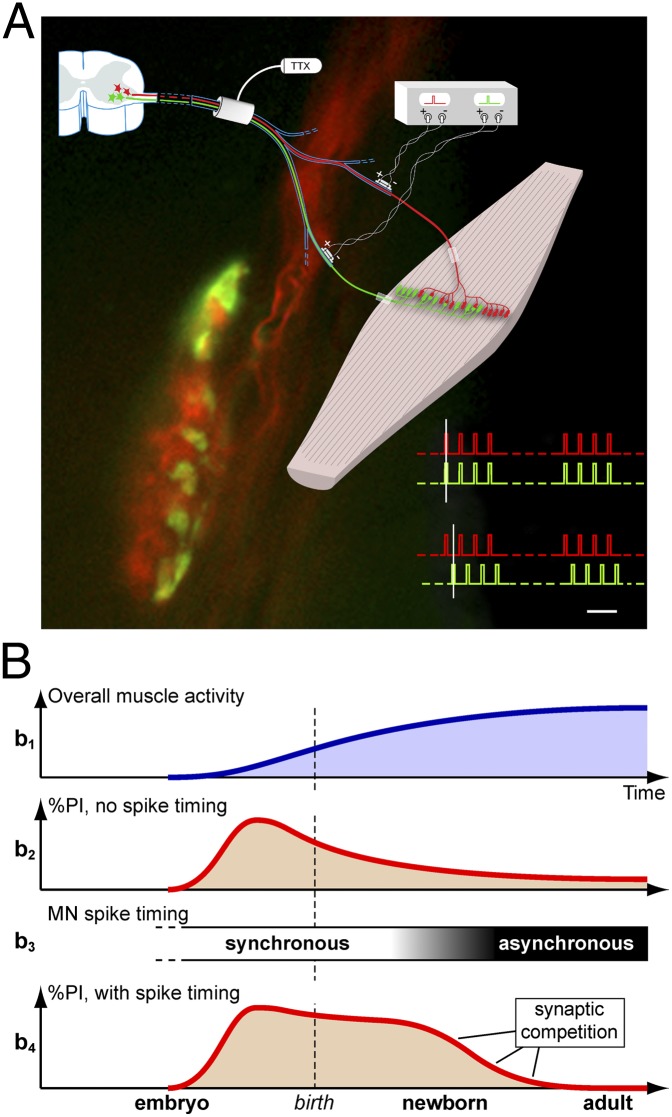
Nerve impulse activity produces both developmental and adult plastic changes in neural networks. For development, however, its precise role and the mechanisms involved remain elusive. Using the classic model of synapse competition and elimination at newly formed neuromuscular junctions, we asked whether spike timing is the instructive signal at inputs competing for synaptic space. Using a rat strain whose soleus muscle is innervated by two nerves, we chronically evoked different temporal spike patterns in the two nerves during synapse formation in the adult. We found that asynchronous activity imposed upon the two nerves promotes synapse elimination, provided that their relative spikes are separated by 25 ms or more; remarkably, this elimination occurs even though an equal number of spikes were evoked in the competing axons. On the other hand, when spikes are separated by 20 ms or less, activity is perceived as synchronous, and elimination is prevented. Thus, in development, as in adult plasticity, precise spike timing plays an instructive role in synaptic modification.


Conflict of interest statement

The authors declare no conflict of interest.

Figures

Fig. 1.
Fig. 1.
Experimental plan and patterns of electrical stimulation. (A) Schematic of the placement of chronic conduction blocking, nerve crushing, and chronic stimulating electrodes of soleus and aberrant nerves. Shown are fields of reinnervation after crushing. (BF) Different timings of stimuli trains. Each nerve receives one train of eight 100-μs pulses every 11 s, 62.836 pulses per day (except in F, see below); train pulse frequency is 20 Hz (except for 10 Hz in E and a subpattern of D). (B) Synchronous trains and stimuli. (C) Asynchronous trains (i.e., alternating trains, with equally spaced intervals). (D) Synchronous trains and asynchronous stimuli, with even intervals between the stimuli to the two nerves (50 and 25 ms, respectively, for the two subpatterns of 10- and 20-Hz pulse frequency). (E) Synchronous trains and asynchronous stimuli, with uneven intervals (20 and 80 ms); frequency 10 Hz. (F) Two series consisting of three versus eight and five versus 12 stimuli in the trains (each nerve received 20-Hz trains every 11 s; total numbers per day are given in Materials and Methods and other details in Results). Dashed vertical lines in D and E help visualize the timing relationship between stimuli to the two nerves.
Fig. 2.
Fig. 2.
Equal amounts of synchronous and asynchronous spike activity have different effects on synapse elimination. (A) Effects of chronic electrical stimulation on level of polyneuronal innervation at NMJs reinnervated by soleus and aberrant axons (both-nerves fields) under the conditions shown in Fig. 1A. A synchronous paradigm (Sync) (six muscles; pattern in Fig. 1B) induces higher polyinnervation than three asynchronous paradigms pooled together (Async) (12 muscles: four with asynchronous trains; three with asynchronous stimuli, 50-ms interval; five with asynchronous stimuli, 25-ms interval; patterns shown in Fig. 1 C and D). Results are presented as mean ± SEM; the number of muscles is shown above the columns. The 144 fibers innervated from both nerves in the synchronous group correspond to 24.9 ± 2.35% of all innervated fibers of the both-nerves territory, whereas the 336 fibers in the asynchronous group correspond to only 9.4 ± 1.55%; ***P < 0.0005. (B) Persistence of high polyinnervation level with increasing amounts of activity evoked with chronic electrical stimulation (all synchronous paradigms). Number of stimuli per day is shown inside columns. For each level of imposed activity, data from soleus and aberrant same-nerve fields are pooled together; for the column of 62,836 stimuli, synchronous both-nerves fields are used also. P = NS for differences between columns [F(4,55) = 1.2, P = 0.323, ANOVA]; **P < 0.01 and ***P < 0.0005 for differences between each column and the asynchronously activated muscles shown in A (the mean of the latter is indicated by the dashed line across columns).
Fig. 3.
Fig. 3.
Sizes of fields of innervation of soleus and aberrant nerves. (A) Plot of the number of polyneuronally innervated fibers versus the total number of innervated fibers per muscle (same-nerve fields) shows positive correlation for both soleus and aberrant axons (r = 0.83). (B) The same plot for synchronous and asynchronous both-nerves fields (data already shown in Fig. 2A). The difference in the number of innervated fibers in the two groups was not significant (P = 0.53): asynchronous, mean 28 ± 4.0, range 10–60; synchronous, mean 24 ± 3.4, range 11–36. Also displayed in B are nine regions [three both-nerves and six same-nerve (three aberrant nerves and three soleus nerves)] from three control muscles in which no block or stimulation was applied, with the reinnervating axons maintaining their natural activity.
Fig. 4.
Fig. 4.
Specific paradigms of asynchronous spike activity and time window of effects of synchrony. (A) Polyinnervation levels of various muscle groups, in order (left to right) of increasing delay between spikes in the competing (aberrant versus soleus) inputs. Data reveal a time window (zero to 20–25 ms) within which the timing of these spikes is sensed as not competition-promoting, thus maintaining polyinnervation. Column 1: same-nerve fields of the asynchronously activated muscles of Fig. 2A (labeled 0 ms interval); Column 2: Both-nerves fields of synchronously activated muscles of Fig. 2A (also 0 ms); Column 3: both-nerves fields of the asynchronous/uneven interval group of 20–80 ms (labeled 20 ms, pattern in Fig. 1E), definable as synchronous-like according to its effects; Column 4: both-nerves fields of the asynchronous/even interval groups (two columns: 25 ms/20 Hz and 50 ms/10 Hz, pattern in Fig. 1D); Column 5: asynchronous trains (pattern in Fig. 1C); Column 6: natural activity. ++P < 0.002 for differences between indicated columns [F(5,36) = 4.9; P = 0.0016, ANOVA]. **P < 0.01 for the individual comparisons relative to the synchronous both-nerves group (column 2). Values of columns 1 and 3 are not significantly different from column 2. (B) Polyinnervation levels in both-nerves regions of two new series of muscles in which the soleus and aberrant nerve received different numbers of stimuli (three versus eight, and five versus 12, and vice-versa) in each train, the stimuli in common being synchronous (pattern in Fig. 1F). Data from soleus and aberrant fields with the same number of stimuli are pooled together. Comparison with the synchronously activated both-nerves fields of Fig. 2A, where the two nerves received an equal number of stimuli (eight/eight, for each train), shows that the different quantity of stimuli promotes competition. +++P < 0.0001 for differences between the indicated columns [F(2,18) = 17.7; P = 0.00006, ANOVA], *P < 0.05 and **P < 0.01 for the individual comparisons. Note that the same-nerve fields of this group with different numbers of stimuli, characterized by various amounts of imposed activity, are shown in Fig. 2B. In both A and B, number of muscles is given above columns. In B, for three vs. eight stimuli (3/8 column), three soleus and three aberrant nerves were the more stimulated nerve; for five vs. 12 stimuli, one soleus and four aberrant nerves were the more stimulated nerve. For fields of natural activity n = 7 instead of 9 shown in Fig. 3B (white circles), because here the cutoff of 12 innervated fibers is applied to the same-nerve fields (Materials and Methods).
Fig. 5.
Fig. 5.
Convergent polyneuronal innervation, interdigitation between soleus and aberrant axon terminals, and EPP occlusion. (A) Confocal image of dually innervated endplates [upper synapse (*) and also, by terminal sprouting, the lower one to the right]; soleus and aberrant axons stimulated synchronously for 10 d. (B) Examples of interdigitating terminals of aberrant (green) and soleus (red) reinnervating axons detected by fluorescence microscopy after activity-dependent uptake of styryl dyes (11 d of synchronous stimulation). (C) Inset: example of EPPs occlusion recorded at a reinnervated endplate, evoked by single-shock stimulation of the soleus nerve (Sol), the aberrant nerve (Ab), or both. The dashed line indicates the nonlinear summation (NLS) level (Materials and Methods). The voltage difference between the NLS expected peak amplitude and the measured amplitude of combined EPPs gives an estimate of the amount of occlusion, formalized as the occlusion index [the ratio between the above indicated difference and the maximum possible difference (the latter being the NLS expected peak amplitude minus the larger EPP amplitude)]. (C) The mean level of the occlusion index for synchronous (Sync) and asynchronous (Async) data indicates a significantly higher occlusion in the synchronous group (*P = 0.0116). The number of endplates is stated above columns. (Scale bars: 10 μm.)
Fig. 6.
Fig. 6.
Factors involved in synapse elimination. (A) Factors known or proposed in the literature to affect synapse elimination, and their relationship with present results on the role of spike-timing (the complete list of citations is found in the Discussion). (B) Relationship between the two main activity-dependent mechanisms (overall activity and spike timing) affecting the entire developmental time course of neuromuscular innervation. b1, overall muscle activity. b2, influence of overall activity alone on the level of polyneuronal innervation (PI). Zero value on ordinate indicates monoinnervation; zero value on abscissa indicates onset of embryonic development. b3, relative timing of spike activity between competing inputs, with physiological transition from synchrony to asynchrony. b4, combined influence of overall activity and spike timing on PI level. MN, motoneuron.
Fig. P1.
Fig. P1.
Importance of spike timing in the process of synapse competition and elimination at regenerating neuromuscular junctions. (A) The cartoon depicts the adult soleus muscle of a rat strain (AO), with its peculiar innervation by two nerves, the soleus (red) and the aberrant (green). This innervation allows us to investigate how the timing of nerve impulses controls competition during formation of new neuromuscular synapses, following regeneration after crushing (rectangular boxes). (Lower Right) Two models of evoked action potential activity are compared, synchronous (Upper) and asynchronous (Lower). (Scale bar: 100 ms; duration of single stimuli are shown out of scale). In the background a synapse exhibiting two competing terminals with different colors is visualized by fluorescence microscopy. (B) Relationship between the two main activity-dependent mechanisms (overall activity and spike timing), affecting the entire developmental time course of neuromuscular innervation. (b1) Overall muscle activity. (b2) Influence of overall activity alone on polyneuronal innervation (PI) level. Ordinate and abscissa values of zero indicate monoinnervation and onset of embryonic development, respectively. (b3) Relative timing of spike activity between competing inputs, with postnatal physiological transition from synchrony to asynchrony. MN, motoneuron. (b4) Combined influence of overall activity and of spike timing on the PI level.

Similar articles

Cited by

References

    1. Hubel DH, Wiesel TN. Binocular interaction in striate cortex of kittens reared with artificial squint. J Neurophysiol. 1965;28:1041–1059. - PubMed
    1. Katz LC, Shatz CJ. Synaptic activity and the construction of cortical circuits. Science. 1996;274:1133–1138. - PubMed
    1. Stent GS. A physiological mechanism for Hebb’s postulate of learning. Proc Natl Acad Sci USA. 1973;70:997–1001. - PMC - PubMed
    1. Bliss TV, Lomo T. Long-lasting potentiation of synaptic transmission in the dentate area of the anaesthetized rabbit following stimulation of the perforant path. J Physiol. 1973;232:331–356. - PMC - PubMed
    1. Malenka RC, Bear MF. LTP and LTD: An embarrassment of riches. Neuron. 2004;44:5–21. - PubMed

Publication types

LinkOut - more resources