. 2012 Aug 15;21(16):3604-18.
doi: 10.1093/hmg/dds191. Epub 2012 May 22.

Spg20-/- mice reveal multimodal functions for Troyer syndrome protein spartin in lipid droplet maintenance, cytokinesis and BMP signaling

Affiliations

Spg20-/- mice reveal multimodal functions for Troyer syndrome protein spartin in lipid droplet maintenance, cytokinesis and BMP signaling

Benoît Renvoisé et al. Hum Mol Genet. .

Abstract

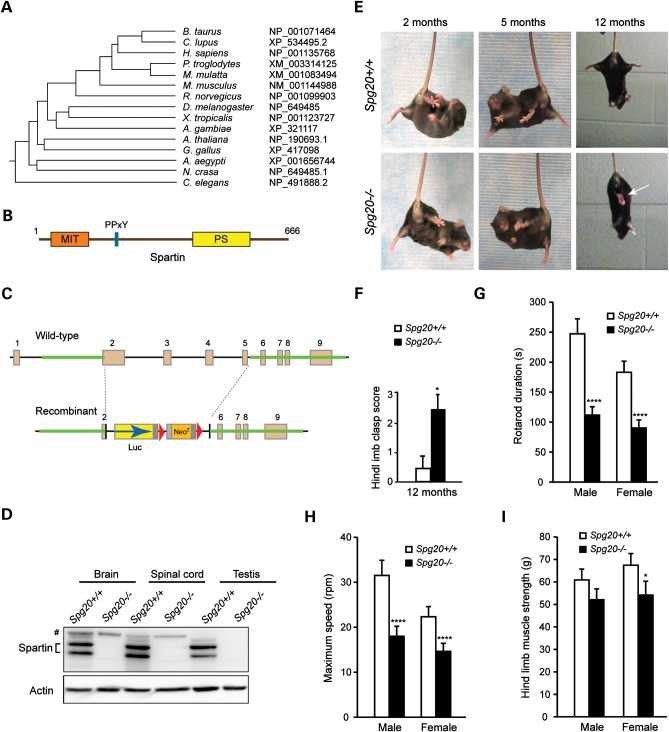
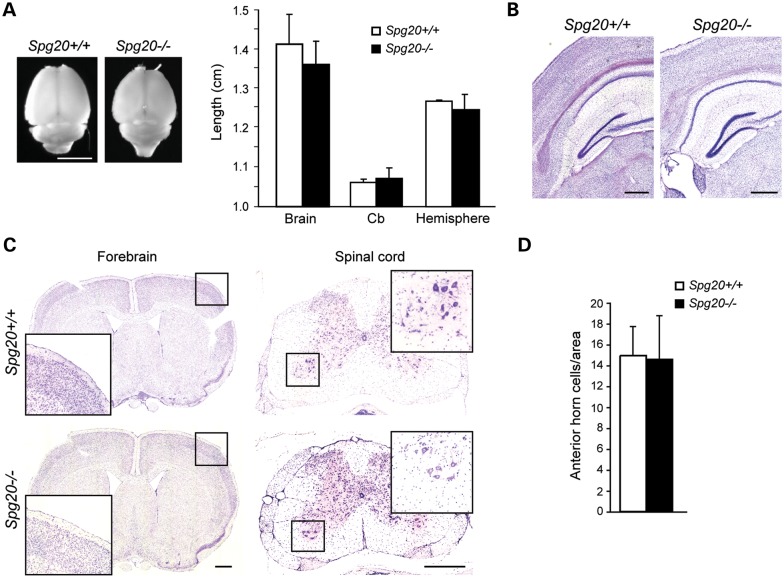
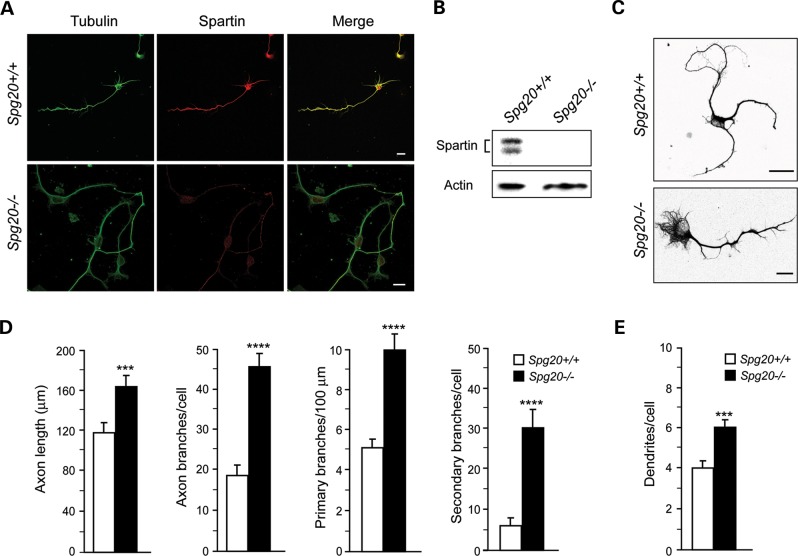
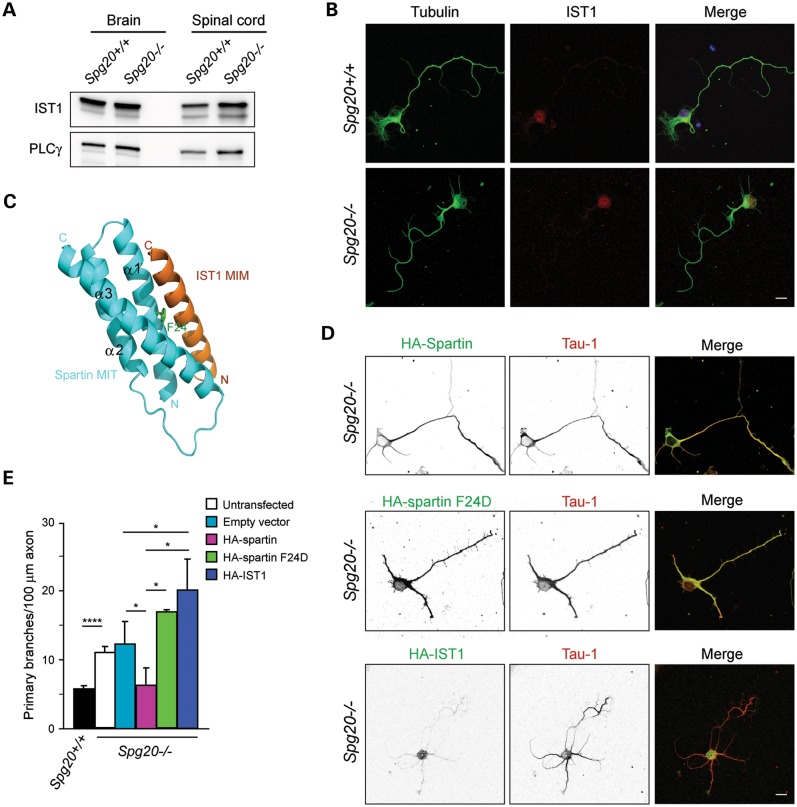
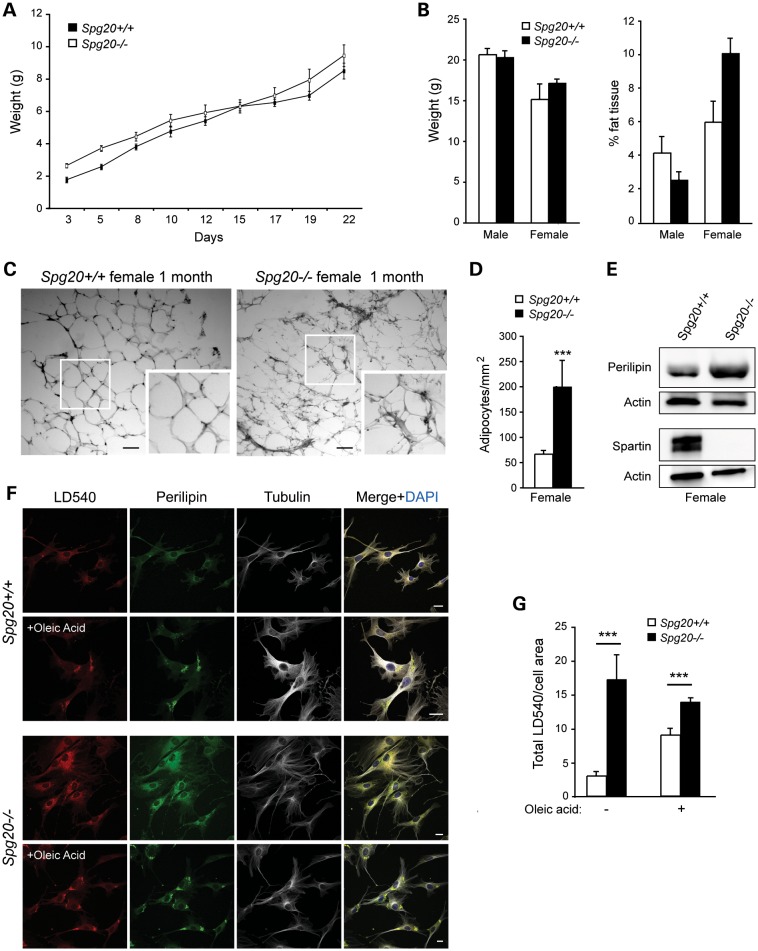
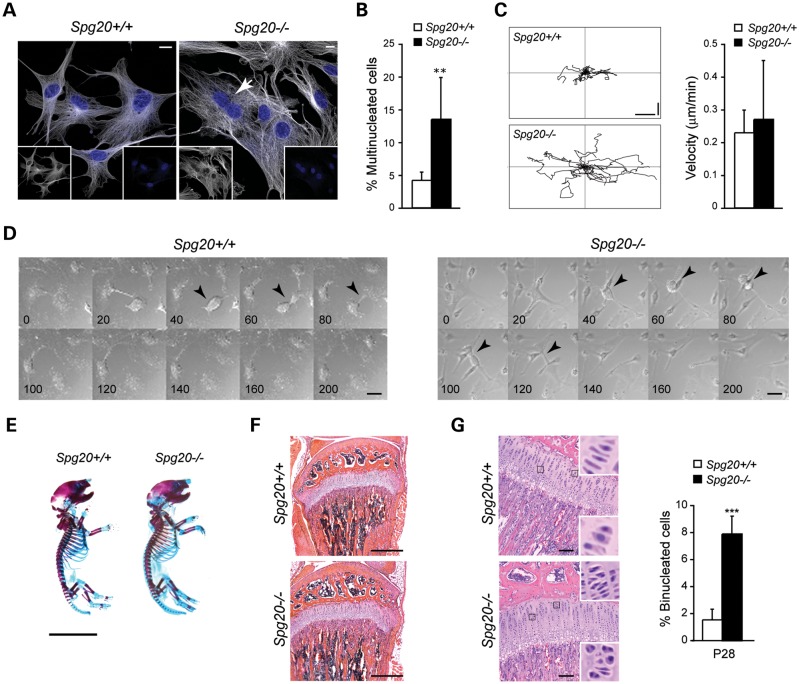
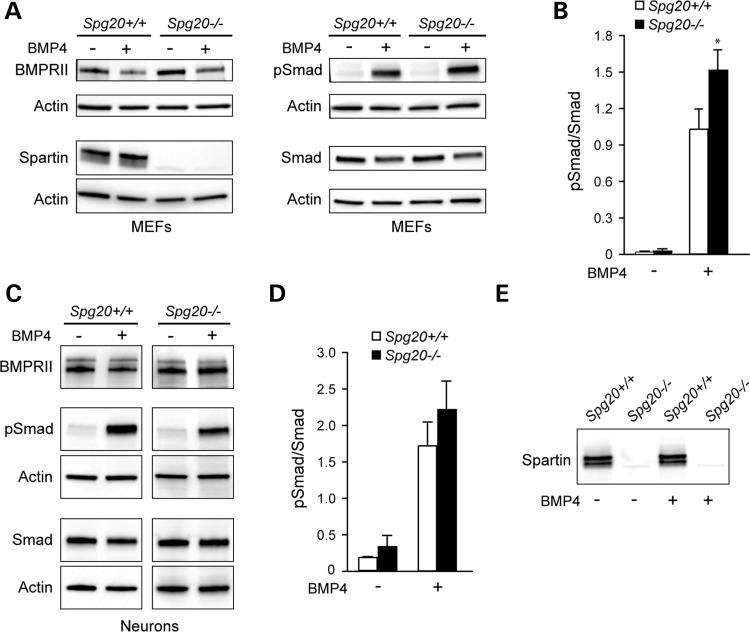
Hereditary spastic paraplegias (HSPs; SPG1-48) are inherited neurological disorders characterized by lower extremity spasticity and weakness. Loss-of-function mutations in the SPG20 gene encoding spartin cause autosomal recessive Troyer syndrome (SPG20), which has additional features of short stature, cognitive deficits and distal amyotrophy. To identify cellular impairments underlying Troyer syndrome, we generated Spg20-/- mice, which exhibit progressive gait defects. Although gross central nervous system pathology appeared largely normal, cerebral cortical neurons cultured from neonatal Spg20-/- mice exhibited increased axon branching, a phenotype suppressed by reintroducing spartin and which required its interaction with the endosomal sorting complex required for transport (ESCRT)-III protein IST1. Analysis of the bone morphogenetic protein (BMP) signaling pathway in Spg20-/- embryonic fibroblasts indicated that Smad1/5 phosphorylation is modestly elevated, possibly due to alterations in BMP receptor trafficking. Cytokinesis was impaired in embryonic fibroblasts cultured from Spg20-/- mice, and binucleated chondrocytes were prominent in epiphyseal growth plates of bones in Spg20-/- mice, perhaps explaining the short stature of patients. Finally, adipose tissue from Spg20-/- female mice exhibited increased lipid droplet (LD) numbers and alterations in perilipin levels, supporting a role for spartin in LD maintenance. Taken together, our results support multimodal functions for spartin that provide important insights into HSP pathogenesis.


Figures

Figure 1.
Figure 1.
Generation of Spg20−/− knock out mice. (A) Spartin phylogenetic tree. Species and GenBank protein accession numbers are shown. The tree was constructed using ClustalW (v1.4). (B) Schematic diagram of spartin. MIT, present in microtubule-interacting and trafficking proteins; PS, plant-related senescence domain. Amino acid residue numbers are shown along the top. (C) Generation of Spg20−/− mice. Schematic representation of the Spg20 gene targeting strategy, with Spg20 exons numbered. Luc, luciferase; Neor, neomycin resistance. (D) Immunoblot analysis of spartin protein in brain, spinal cord and testis lysates from adult Spg20+/+ and Spg20−/− mice. Actin levels were monitored as a control for protein loading. # denotes a cross-reactive protein band. (E) Suspension reflex testing of Spg20+/+ and Spg20−/− mice at 2, 5 and 12 months of age. An arrow denotes clasped hind limbs. (F) Quantification of hind limb clasping at 12 months (means ± SD). Scores were tallied after suspending mice by the tail: 0, normal; 1, hind limbs touching for 1–15 s; 2, hindlimbs touching for 16–30 s; 3, hindlimbs touching for >30 s. (G and H) Rotarod testing of Spg20+/+ (n = 24) and Spg20−/− (n = 44) mice at 4–7 months of age, with quantification of duration (G) and maximum speed (H), means ± SD. (I) Hind limb muscle strength was quantitated in Spg20+/+ and Spg20−/− mice at 4–7 months of age (n = 24 and 44, respectively). *P < 0.05; ****P < 0.001.
Figure 2.
Figure 2.
Neuropathologic analysis of Spg20−/− mice. (A) Dorsal view of whole-mount adult brain (left) and measurements of whole-mount brain, cerebellum (Cb) and cerebral hemisphere length (right). Left and right sides of brain were measured as replicates, and average lengths were calculated. Means ± SD are graphed (n = 3 animals per genotype). Scale bar, 1 cm. (B) Nissl-stained parasagittal sections of brains from Spg20+/+ and Spg20−/− adult mice. Scale bar, 50 µm. (C) Left, parasagittal sections of mouse brains stained with H&E. Right, parasagittal sections of cervical spinal cord were stained with cresyl violet. Boxed regions are enlarged in the insets. Scale bar, 500 µm. (D) Relative number of spinal cord anterior horn cells was quantified per 0.6 cm2 area (means ± SD; n = 3).
Figure 3.
Figure 3.
Cerebral cortical neurons cultured from Spg20−/− mice exhibit increased axon branching. (A) Representative neurons at DIV3 were co-stained for β-tubulin (green) and endogenous spartin (red). The merged image is at the right. Scale bar, 10 µm. (B) Immunoblot analysis of spartin protein in total lysates from Spg20+/+ and Spg20−/− cortical neurons. Actin levels were monitored as a control for protein loading. (C) β-tubulin staining (black) reveals processes of Spg20+/+ and Spg20−/− cultured neurons at DIV3. Scale bar, 20 µm. (D) Quantifications of primary axon length as well as number of total, primary, and secondary axon branches in Spg20+/+ and Spg20−/− DIV3 cortical neurons in primary culture (means ± SD; n = 3, with 30–60 neurons per trial). (E) Numbers of dendrites per cell are shown graphically (means ± SD; n = 3, with 30–60 neurons per trial). ***P < 0.005, ****P < 0.001.
Figure 4.
Figure 4.
Interaction with the ESCRT-III protein IST1 is required for spartin-mediated effects on axonal branching. (A) Immunoblot of IST1 protein in total lysates from brain and spinal cord of Spg20+/+ and Spg20−/− mice. PLCγ is a control for protein loading. (B) Representative cultured cerebral cortical neurons from Spg20+/+ and Spg20−/− mice stained with β-tubulin (green) and IST1 (red). Scale bar, 20 µm. (C) Structural model of spartin MIT domain (blue) interacting with IST1 MIT-interacting motif (MIM; orange). Residue Phe24 (F24) in the spartin MIT domain is shown in green. Adapted from ref. 21. (D) Spg20−/− neurons overexpressing wild-type HA-spartin, HA-spartin F24D or HA-IST1 were co-stained with HA-tag (green) and Tau-1 (red) antibodies. Black and white images are at the left, and merged color images are to the right. Scale bar, 20 µm. (E) Quantification of number of branches per 100 µm of axon in DIV3 cortical neurons, transfected as indicated (n = 3, with 30 neurons per trial). The genotype is shown below. *P < 0.005, ****P < 0.001.
Figure 5.
Figure 5.
LD defects in Spg20−/− mice. (A) Body weight measurements of Spg20+/+ (n = 9) and Spg20−/− (n = 8) mice, ages 3–22 days. (B) Graphical representation of weight and percentage of adipose tissue in male and female Spg20+/+ and Spg20−/− mice at one month of age (means ± SD; n = 3). (C) Sections of adipose tissue in one month-old Spg20+/+ and Spg20−/− female mice. Insets show enlargements of the boxed areas. Scale bar, 100 µm. (D) Number of adipocytes/mm2 in female Spg20+/+ and Spg20−/− mice. (E) Immunoblots of total adipose tissue lysates from 4-month-old Spg20+/+ and Spg20−/− females. Actin levels were monitored as a control for protein loading. (F) Immunofluorescence staining of LD540, perilipin and β-tubulin on MEFs from Spg20+/+ and Spg20−/− mice. Cells were treated with oleic acid where indicated. Scale bars, 10 µm. (G) Graphical representation of total LD540 staining intensity in Spg20+/+ and Spg20−/− MEFs treated or not with oleic acid (means ± SD; n = 20). ***P < 0.005.
Figure 6.
Figure 6.
Cytokinesis defects in cells from Spg20−/− mice. (A) Representative MEFs from Spg20+/+ and Spg20−/− mice stained with β-tubulin (white) and DAPI (blue). The merged image is shown, and an arrow identifies a binucleated cell. Individual channels are shown as insets. Scale bar, 10 µm. (B) Quantification of multinucleated MEFs in Spg20+/+ and Spg20−/− mice. **P < 0.01. (C) Left, Representative trajectories of individual primary Spg20+/+ and Spg20−/− MEFs from the frame-by-frame analysis of the time-lapse recordings during a 14-hour observation period. Vertical and horizontal scale bars, 50 µm. Right, Migration velocities of the indicated MEFs are graphed (means ± SD; n = 20). Migration data comprise at least 10 cells from 3 independent Spg20+/+ and Spg20−/− pairs. (D) Time-lapse DIC images from 200 min of analysis, with times indicated. Arrowheads indicate dividing cells. Scale bar, 10 µm. (E) Whole mount Alcian Blue/Alizarin Red staining of Spg20+/+ and Spg20−/− mouse skeletons at P1. Scale bar, 1 cm. (F) H&E-stained sections of the proliferative zone of the tibial epiphyseal growth plate of Spg20+/+ and Spg20−/− mice. Scale bar, 500 µm. (G) Left, H&E-stained sections of the knee joint region of P28 Spg20+/+ and Spg20−/− mice. The indicated areas are enlarged in the insets, demonstrating multiple binucleated chondrocytes. Right, Quantification of binucleated cells in growth plates of P28 Spg20+/+ and Spg20−/− mice (means ± SD; n = 3 trials, with 100 cells per trial for each genotype). ***P < 0.005. Scale bar, 100 µm.
Figure 7.
Figure 7.
Alterations in BMP signaling and receptor degradation in Spg20−/− cells. (A) Immunoblot analysis of BMPRII, spartin, Smad and phospho-Smad (pSmad) expression levels in MEFs from Spg20+/+ and Spg20−/− mice, with or without BMP4 addition as indicated. (B) Quantification of pSmad/Smad ratio in Spg20+/+ and Spg20−/− MEFs (means ± SD; n = 3). *P < 0.05. (C) Immunoblot analysis of BMPRII, spartin, pSmad, Smad and EGFR protein levels in extracts from Spg20+/+ and Spg20−/− cultured cerebral cortical neurons. (D) Quantification of pSmad/Smad ratio in Spg20+/+ and Spg20−/− neurons (means ± SD; n = 3). (E) Immunoblot analysis of spartin levels in neurons from Spg20+/+ and Spg20−/− mice, with or without BMP4 addition as indicated.

Similar articles

Cited by

References

    1. Salinas S., Proukakis C., Crosby A., Warner T.T. Hereditary spastic paraplegia: clinical features and pathogenetic mechanisms. Lancet Neurol. 2008;7:1127–1138. - PubMed
    1. Blackstone C., O'Kane C.J., Reid E. Hereditary spastic paraplegias: membrane traffic and the motor pathway. Nat. Rev. Neurosci. 2011;12:31–42. - PMC - PubMed
    1. Harding A.E. Classification of the hereditary ataxias and paraplegias. Lancet. 1983;1:1151–1155. - PubMed
    1. Fink J.K. Hereditary spastic paraplegia. Curr. Neurol. Neurosci. Rep. 2006;6:65–76. - PubMed
    1. Soderblom C., Blackstone C. Traffic accidents: molecular genetic insights into the pathogenesis of the hereditary spastic paraplegias. Pharmacol. Ther. 2006;109:42–56. - PubMed

Publication types

MeSH terms

Supplementary concepts