. 2012 Aug 15;446(1):23-36.
doi: 10.1042/BJ20112024.

Myostatin is a novel tumoral factor that induces cancer cachexia

Affiliations

Myostatin is a novel tumoral factor that induces cancer cachexia

Sudarsanareddy Lokireddy et al. Biochem J. .

Erratum in

Retraction in

Abstract

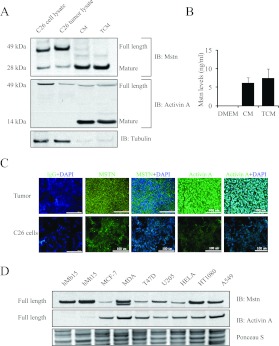
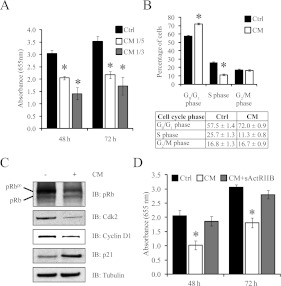
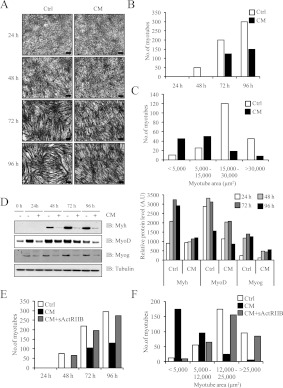
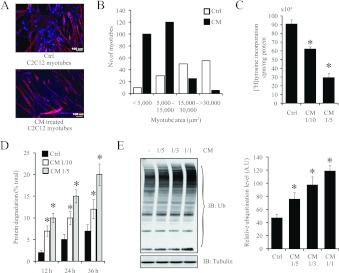
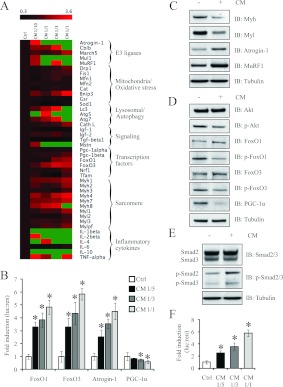
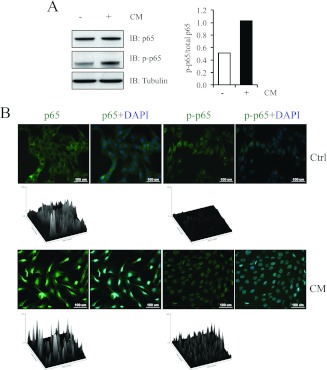
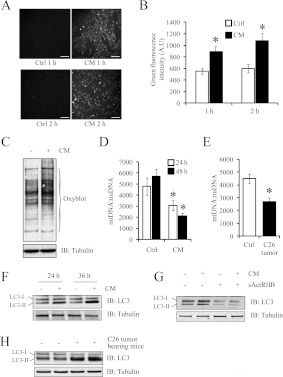
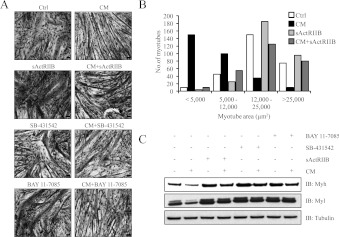
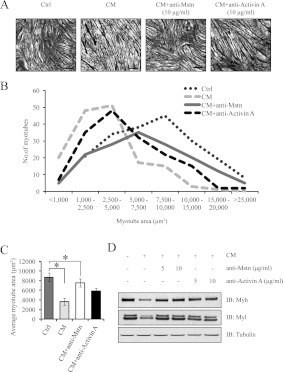
Humoral and tumoral factors collectively promote cancer-induced skeletal muscle wasting by increasing protein degradation. Although several humoral proteins, namely TNFα (tumour necrosis factor α) and IL (interleukin)-6, have been shown to induce skeletal muscle wasting, there is a lack of information regarding the tumoral factors that contribute to the atrophy of muscle during cancer cachexia. Therefore, in the present study, we have characterized the secretome of C26 colon cancer cells to identify the tumoral factors involved in cancer-induced skeletal muscle wasting. In the present study, we show that myostatin, a procachectic TGFβ (transforming growth factor β) superfamily member, is abundantly secreted by C26 cells. Consistent with myostatin signalling during cachexia, treating differentiated C2C12 myotubes with C26 CM (conditioned medium) resulted in myotubular atrophy due to the up-regulation of muscle-specific E3 ligases, atrogin-1 and MuRF1 (muscle RING-finger protein 1), and enhanced activity of the ubiquitin-proteasome pathway. Furthermore, the C26 CM also activated ActRIIB (activin receptor type II B)/Smad and NF-κB (nuclear factor κB) signalling, and reduced the activity of the IGF-I (insulin-like growth factor 1)/PI3K (phosphoinositide 3-kinase)/Akt pathway, three salient molecular features of myostatin action in skeletal muscles. Antagonists to myostatin prevented C26 CM-induced wasting in muscle cell cultures, further confirming that tumoral myostatin may be a key contributor in the pathogenesis of cancer cachexia. Finally, we show that treatment with C26 CM induced the autophagy-lysosome pathway and reduced the number of mitochondria in myotubes. These two previously unreported observations were recapitulated in skeletal muscles collected from C26 tumour-bearing mice.


Figures

Figure 1
Figure 1. C26 CM possesses Mstn and activin A
(A) Immunoblots of Mstn and activin A expression in the C26 cell lysate, C26 tumour lysate, CM and TCM. An immunoblot of tubulin performed on the same membrane shows negligible amounts of the cytoplasmic protein in the CM and TCM. The molecular mass in kDa is indicated on the left-hand side. (B) Mstn levels in the CM and TCM as quantified by sandwich ELISA. (C) Representative confocal microscopy images of isotype control (IgG), Mstn and activin A staining in C26 tumour cryosections and in C26 cells. Scale bars represent 100 μm. (D) Immunoblot analysis of Mstn and activin A expression in human primary myoblasts (hMb15), myotubes (hMt15) and human cancer cell lines [MCF-7, MDA-MB-231 (MDA), T47D, U205, HeLa, HT1080 and A549]. Ponceau S staining indicates equal loading of protein samples. IB, immunoblot.
Figure 2
Figure 2. C26 CM inhibited the proliferation of C2C12 myoblasts
(A) Proliferation of myoblasts when treated with 1:3 and 1:5 dilutions of CM, as measured by the Methylene Blue photometric end-point assay. Absorbance (655 nm) is directly proportional to cell number, and 48 and 72 h represent the time of myoblasts in CM. n=8; values represent means±S.D. (B) The distribution of myoblasts in each phase of the cell cycle when incubated in the absence (Ctrl) or presence of CM for 24 h as assessed by FACS analysis (top panel). A Table indicating the percentages of myoblasts found in the respective phases of the cell cycle is also shown (bottom panel). n=4; values are means±S.D. (C) Immunoblot analysis of pRb, Cdk2, cyclin D1 and p21 expression in C2C12 myoblasts treated with (+) or without (−) CM for 24 h. (D) Proliferation of myoblasts when treated with a 1:3 dilution of CM and sActRIIB (CM+sActRIIB), as measured by the Methylene Blue photometric end-point assay. Absorbance (655 nm) is directly proportional to cell number. Values represent means±S.D. Statistical significance was assessed by Student's t test when compared with the control (Ctrl). *P<0.01. Ctrl, control; IB, immunoblot.
Figure 3
Figure 3. C26 CM prevented myogenic differentiation of C2C12 myoblasts
(A) Haemotoxylin-and-eosin-stained micrographs of C2C12 myoblasts differentiating in low-serum medium (Ctrl) or in the presence of CM diluted 1:5 with low-serum medium. Scale bars represent 100 μm. (B) C2C12 myotube number as quantified from the haemotoxylin-and-eosin-stained micrographs using Image Pro Plus. (C) Myotubular area (μm2) as calculated for the 72 h differentiation time point using Image Pro Plus. (D) Immunoblot analysis of Myh, MyoD and Myog expression in C2C12 myoblasts treated with (+) or without (−) CM over a period of 96 h (left-hand panel). Densitometric analysis of the relative protein levels of Myh, MyoD and Myog, represented as arbitrary units (A.U), at each time point normalized to tubulin (right-hand panel). (E) Number of myotubes formed when C2C12 myoblasts were differentiated in control, CM and CM+sActRIIB. Myotubes were stained with haemotoxylin and eosin (Supplementary Figure S2 at http://www.BiochemJ.org/bj/446/bj4460023add.htm) and counted using Image Pro Plus. (F) Area (μm2) of C2C12 myotubes. Myotube area was calculated from the 72 h differentiation time point (Supplementary Figure S2 at http://www.BiochemJ.org/bj/446/bj4460023add.htm) using Image Pro Plus. Ctrl, control; IB, immunoblot.
Figure 4
Figure 4. C26 CM induced wasting of C2C12 myotubes
(A) Representative confocal micrographs of differentiated C2C12 myotubes treated without (Ctrl) or with CM (1:5 dilution in low-serum medium) for 24 h. Scale bars represent 100 μm. DAPI (blue) highlights the nucleus and red represents Myh staining. (B) The histogram represents myotube area (μm2) in control and CM-treated C2C12 myotubes acquired by Image Pro Plus. (C) CM suppressed protein synthesis in differentiated myotubes. After 24 h of treatment with CM (1:5 and 1:10 dilutions) or control, myotubes were incubated with [3H]tyrosine for 2 h. The radioactivity incorporated was measured and normalized to total protein lysate. n=4; values are means±S.D. (D) CM increased proteolysis in differentiated myotubes. Differentiated myotubes were incubated with [3H]tyrosine for 36 h and then treated with CM (1:5 and 1:10 dilutions). Medium was collected at 12, 24 and 36 h, and the amount of degraded [3H]tyrosine-labelled protein was expressed as a percentage of the initial amount of [3H]tyrosine added. n=4; values are means±S.D. (E) Immunoblot analysis of ubiquitinated proteins in C2C12 myotubes after treatment with various concentrations of CM for 24 h (left-hand panel). Densitometric quantification of the ubiquitin immunoblot, represented as the relative ubiquitination level in arbitrary units (A.U) (right-hand panel). Values are means±S.D., *P<0.01. Ctrl, control; IB, immunoblot; Ub, ubiquitin.
Figure 5
Figure 5. Treatment of C2C12 myotubes with C26 CM activated signalling pathways involved in skeletal muscle wasting
(A) Heat-map analysis of RT-qPCR results, drawn with Orange Canvas, on a selected set of genes that highlight the anabolic and catabolic components affected when myotubes are treated with 1:1, 1:3, 1:5 and 1:10 dilutions of CM (n=6; numeric values are found in Supplementary Table S3 at http://www.BiochemJ.org/bj/446/bj4460023add.htm). Gene expression was normalized to three endogenous controls, Gapdh, Actb and Hprt using the ΔΔCT method. The green colour in the heat-map represents values with a change above 3.6-fold. Atg, autophagy-related; Bnip3, BCL2/adenovirus E1B interacting protein 3; Cat, catalase; Cath L, cathepsin L; Cblb, Casitas B-lineage lymphoma b; Drp1, dynamin 1-like; Fis1, fission 1; Gsr, glutathione reductase; Lc3, light chain 3; Map1lc3a, microtubule-associated protein 1 LC (light chain) 3α; March5, membrane-associated ring finger (C3HC4) 5; Mfn, mitofusin; Mul1, mitochondrial ubiquitin ligase activator of NF-κB 1; Nrf1, nuclear respiratory factor 1; Sod1, superoxide dismutase 1; Tfam, transcription factor A, mitochondrial. (B) Histogram representing the fold induction (luciferase/Renilla ratio, normalized to the control) of FoxO1, FoxO3, atrogin-1 and PGC-1α promoter–reporter constructs in the presence of 1:1, 1:3 and 1:5 dilutions of CM. n=8; values are means±S.D. (C) Immunoblot analysis of Myh, Myl, atrogin-1 and MuRF1 expression in C2C12 myotubes after treatment with (+) or without (−) CM for 24 h. (D) Immunoblot analysis of FoxO1, p-FoxO1, FoxO3, p-FoxO3, Akt, p-Akt and PGC-1α levels following treatment with (+) or without (−) CM. (E) Immunoblot analysis of Smad2/3 expression and phosphorylation status in C2C12 myotubes after treatment with CM for 24 h. (F) Fold induction (luciferase/Renilla ratio, normalized to control) of a Smad reporter construct possessing 4 SBE (4X SBE) repeats after treatment with 1:1, 1:3 and 1:5 dilutions of CM (bottom). n=8; values are means±S.D. Statistical significance was assessed by Student's t test compared with the control; *P<0.01. Ctrl, control; IB, immunoblot; luc/ren, luciferase/Renilla.
Figure 6
Figure 6. C26 CM induced NF-κB activation
(A) Immunoblot analysis of p65 and p-p65 levels in C2C12 myotubes in the absence (−) or presence (+) of CM (left-hand panel). Densitometric quantification of the relative protein levels of p-p65, expressed as a proportion of total p65 (right-hand panel). (B) Confocal micrographs highlighting p65 (green) and p-p65 (green) nuclear localization in control and CM-treated C2C12 myoblasts. Nuclei are stained with DAPI (blue). Scale bars represent 100 μm. Surface plots drawn by ImageJ as calculated from the corresponding confocal images. The images highlight the exclusive nuclear localization of p65 and p-p65 subunits of NF-κB upon treatment with CM. Ctrl, control; IB, immunoblot.
Figure 7
Figure 7. C26 CM promoted ROS induction, mitophagy and increased autophagy–lysosome pathway activity.
(A) Representative micrographs demonstrating ROS induction in myoblasts treated with CM for 1 or 2 h. Scale bars represent 100 μm. (B) Histogram represents the relative green fluorescence intensity in arbitrary units (A.U) calculated using ImageJ software. Values are means±S.D. (C) An OxyBlot assay demonstrating the amounts of oxidized proteins in myotubes after treatment with (+) or without (−) CM. (D) Histogram represents the qPCR quantification of the mtDNA/nuDNA ratio in control or CM-treated myoblasts. n=4; values are means±S.D. (E) Histogram represents the qPCR quantification of the mtDNA/nuDNA ratio in TA muscle isolated from day 17 C26 tumour-bearing mice (C26 tumour) and control mice. n=5; values are means±S.D. (F) Immunoblot analysis of LC3-I into LC3-II conversion in control (−) and CM-treated (+) C2C12 myotubes incubated for 24 and 36 h. (G) Immunoblot analysis of LC3-I into LC3-II conversion in C2C12 myotubes treated with CM and CM+sActRIIB for 24 h. (H) Immunoblot analysis of LC3-I into LC3-II conversion in TA muscle isolated from control CD2F1 mice (−) and 17 day C26 tumour-bearing CD2F1 mice (+). Statistical significance was assessed by Student's t test compared with the control; *P<0.01. Ctrl, control; IB, immunoblot.
Figure 8
Figure 8. Mstn, activin A and NF-κB inhibitors ameliorated C26 CM-induced muscle wasting
(A) Treatment with sActRIIB, SB 431542 and BAY 11-7085 attenuates C2C12 myotube atrophy induced by C26 CM. Haemotoxylin-and-eosin-stained micrographs of C2C12 myotubes with or without CM in the absence or presence of sActRIIB, SB 431542 and BAY 11-7085. Scale bars represent 100 μm. Note: the wasting phenotype observed in myotubes exposed to CM was reversed by the addition of the Mstn (sActRIIB), Smad2/3 (SB 431542) and NF-κB (BAY 11-7085) inhibitors. (B) Histogram represents the myotube area (μm2) in control, CM-, sActRIIB- and CM+ActRIIB-treated C2C12 myotubes as quantified by Image Pro Plus. (C) Immunoblot analysis of Myh and Myl expression showing rescue in response to treatment with (+) or without (−) sActRIIB, SB 431542 and BAY 11-7085 in the presence (+) and absence (−) of CM. Ctrl, control; IB, immunoblot.
Figure 9
Figure 9. Specific inhibitors of Mstn and activin A reduced C26 CM-induced cancer cachexia
(A) Haemotoxylin-and-eosin-stained micrographs of C2C12 differentiated myotubes treated for 24 h with low-serum medium (Ctrl), CM, CM pre-incubated with anti-Mstn antibody (CM+anti-Mstn) and CM pre-incubated with anti-activin A antibody (CM+anti-activin A). Scale bars represent 100 μm. (B) The line graph represents the myotube area (μm2) of control, CM-, CM+anti-Mstn- and CM+anti-activin A-treated C2C12 myotubes as calculated by Image Pro Plus. (C) Average myotube area (μm2) of C2C12 myotubes treated with control, CM, CM+anti-Mstn and CM+anti-activin A. (D) Immunoblot analysis of Myh and Myl expression in C2C12 myotubes exposed to control, CM, CM+anti-Mstn and CM+anti-activin A. Statistical significance was assessed by Student's t test compared with the control; *P<0.01. Ctrl, control; IB, immunoblot.

References

    1. Tisdale M. J. Mechanisms of cancer cachexia. Physiol. Rev. 2009;89:381–410. - PubMed
    1. Tisdale M. J. Molecular pathways leading to cancer cachexia. Physiology. 2005;20:340–348. - PubMed
    1. Tisdale M. J. The ubiquitin-proteasome pathway as a therapeutic target for muscle wasting. J. Support. Oncol. 2005;3:209–217. - PubMed
    1. Fearon K. C. Cancer cachexia: developing multimodal therapy for a multidimensional problem. Eur. J. Cancer. 2008;44:1124–1132. - PubMed
    1. Lokireddy S., McFarlane C., Ge X., Zhang H., Sze S. K., Sharma M., Kambadur R. Myostatin induces degradation of sarcomeric proteins through a Smad3 signaling mechanism during skeletal muscle wasting. Mol. Endocrinol. 2011;25:1936–1949. - PMC - PubMed

Publication types

MeSH terms