. 2012 Jun;122(6):1973-90.
doi: 10.1172/JCI61495. Epub 2012 May 24.

MicroRNA-181b regulates NF-κB-mediated vascular inflammation

Affiliations

MicroRNA-181b regulates NF-κB-mediated vascular inflammation

Xinghui Sun et al. J Clin Invest. 2012 Jun.

Abstract

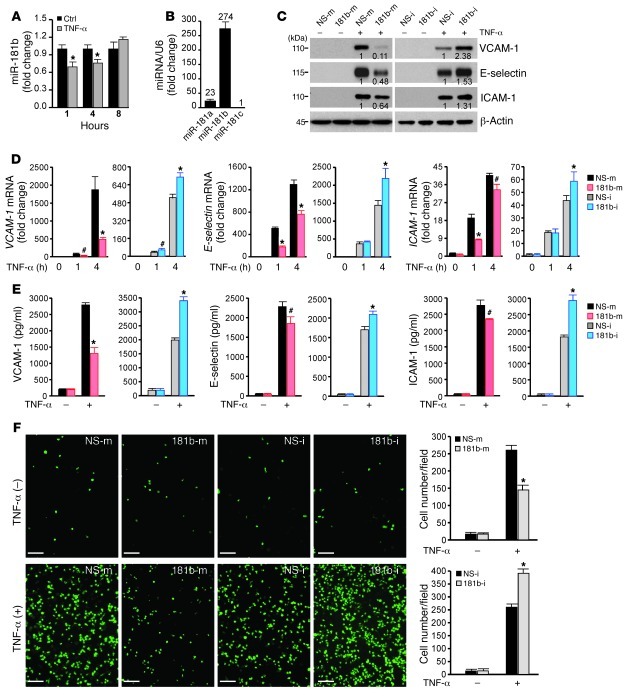
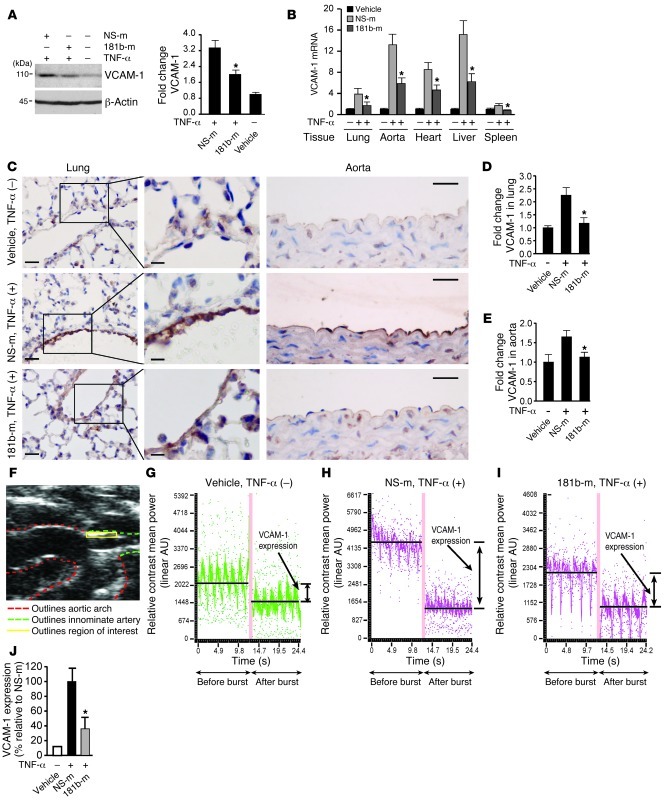
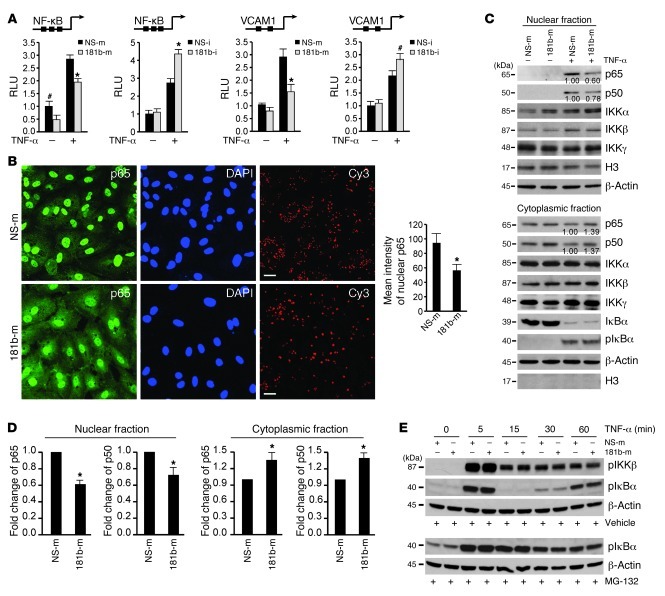
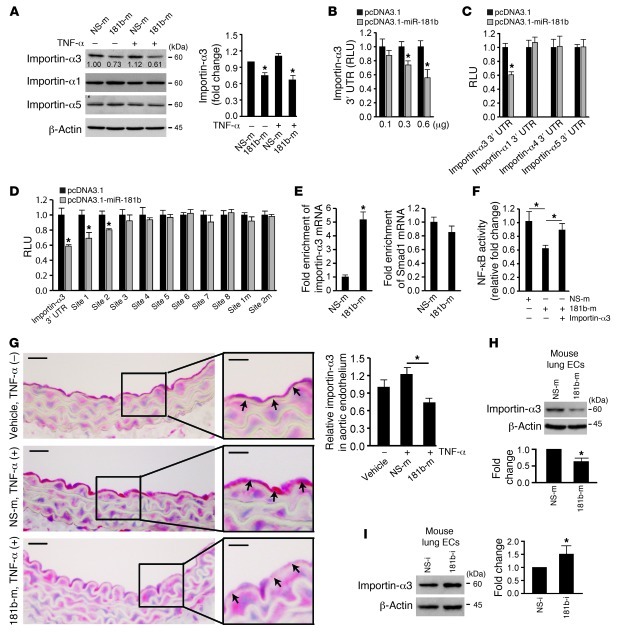
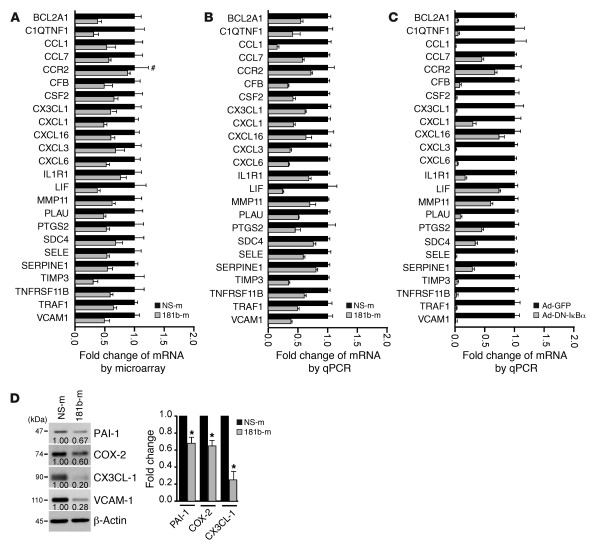
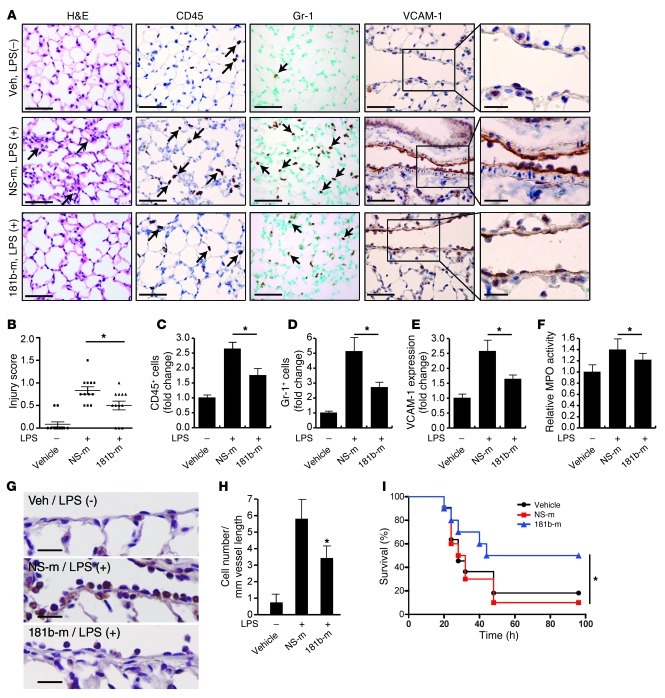
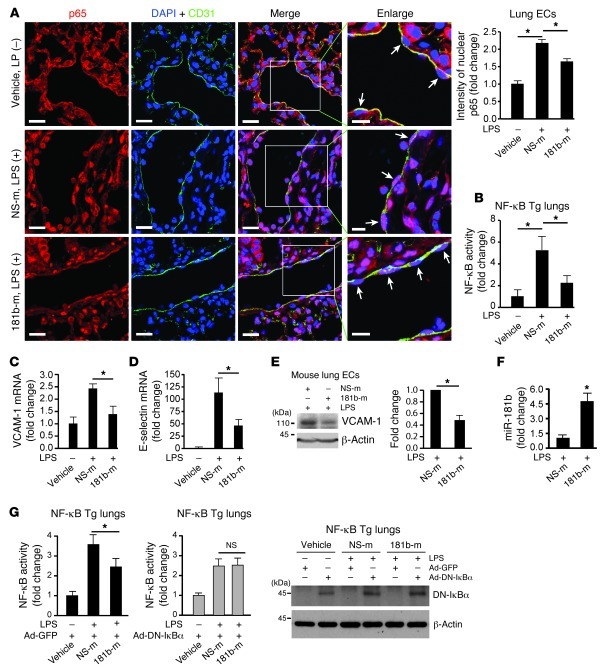
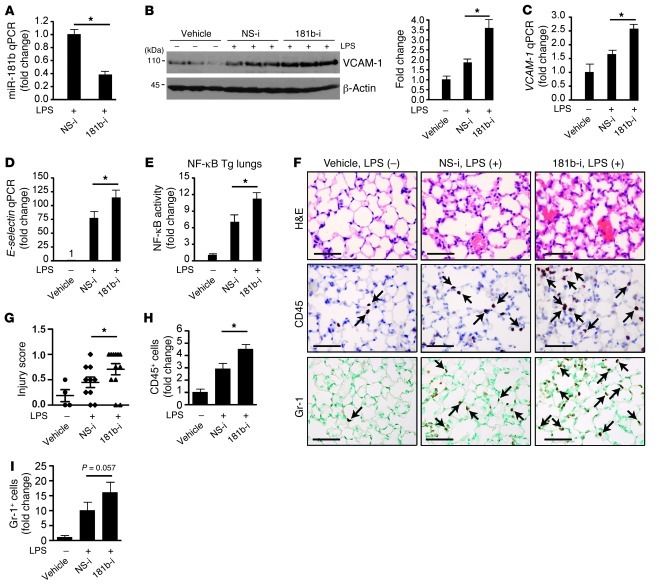
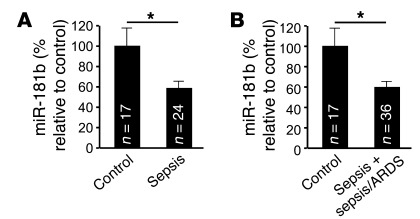
EC activation and dysfunction have been linked to a variety of vascular inflammatory disease states. The function of microRNAs (miRNAs) in vascular EC activation and inflammation remains poorly understood. Herein, we report that microRNA-181b (miR-181b) serves as a potent regulator of downstream NF-κB signaling in the vascular endothelium by targeting importin-α3, a protein that is required for nuclear translocation of NF-κB. Overexpression of miR-181b inhibited importin-α3 expression and an enriched set of NF-κB-responsive genes such as adhesion molecules VCAM-1 and E-selectin in ECs in vitro and in vivo. In addition, treatment of mice with proinflammatory stimuli reduced miR-181b expression. Rescue of miR-181b levels by systemic administration of miR-181b "mimics" reduced downstream NF-κB signaling and leukocyte influx in the vascular endothelium and decreased lung injury and mortality in endotoxemic mice. In contrast, miR-181b inhibition exacerbated endotoxin-induced NF-κB activity, leukocyte influx, and lung injury. Finally, we observed that critically ill patients with sepsis had reduced levels of miR-181b compared with control intensive care unit (ICU) subjects. Collectively, these findings demonstrate that miR-181b regulates NF-κB-mediated EC activation and vascular inflammation in response to proinflammatory stimuli and that rescue of miR-181b expression could provide a new target for antiinflammatory therapy and critical illness.


Figures

Figure 1
Figure 1. miR-181b suppresses TNF-α–induced proinflammatory gene expression in HUVECs.
(A) Real-time qPCR analysis of miR-181b in response to TNF-α (10 ng/ml) in HUVECs. (B) Real-time qPCR analysis of miR-181a, miR-181b, and miR-181c in HUVECs. Numbers over bars indicate fold change relative to miR-181c. (C) Western blot analysis of VCAM-1, E-selectin, and ICAM-1 in HUVECs transfected with miRNA negative control (NS-m) or miR-181b mimics (181b-m), miRNA inhibitor negative control (NS-i), or miR-181b inhibitor (181b-i), respectively, after treatment with 10 ng/ml TNF-α for 8 hours. Densitometry was performed and fold change of protein expression is shown below the corresponding band. (D) Real-time qPCR analysis of VCAM-1, E-selectin, and ICAM-1 mRNA levels in HUVECs transfected with miRNA negative control, miR-181b mimics, miRNA negative control, or miR-181b inhibitor, and treated with 10 ng/ml TNF-α for the indicated times. (E) ELISA analysis of elaborated VCAM-1, E-selectin, and ICAM-1 protein levels in cell culture medium 16 hours after TNF-α (10 ng/ml) treatment. HUVECs were transfected as indicated in A. (F) miR-181b regulates the adhesion of THP-1 cells to TNF-α–activated HUVECs. Photo images of THP-1 cells adhering to HUVECs transfected with miRNA negative control or miR-181b mimics, miRNA inhibitor negative control, or miR-181b inhibitor with or without 10 ng/ml TNF-α treatment for 4 hours. #P < 0.05; *P < 0.01. Scale bars: 100 μm. All values represent mean ± SD.
Figure 2
Figure 2. miR-181b represses TNF-α–induced proinflammatory gene expression in vivo.
(A) Mice were i.v. injected with vehicle, miRNA negative control, or miR-181b mimics (50 μg/mouse). Twenty-four hours later, mice were treated with or without TNF-α for 4 hours, and lungs were harvested for Western blot analysis of VCAM-1 protein levels. Densitometry was performed and fold change of protein expression was quantified. (B) Experiments were carried out as described in A, and real-time qPCR analysis of VCAM-1 mRNA level in indicated tissues was performed. (C) VCAM-1 staining of lung and aorta sections. Mice were treated as in A. Scale bars: 25 μm (insets, 10 μm). (D and E) Quantification of VCAM-1 staining in lung and aortic endothelium, respectively. (AE) Vehicle group (n = 3 mice), miRNA negative control group (n = 5 mice), miR-181b mimics group (n = 5 mice). Data represent mean ± SEM. (F) Ultrasound image shows region of interest (innominate artery) for in vivo VCAM-1 imaging using microbubble contrast. (GI) Mice were injected with vehicle, miRNA negative control (n = 7), or miR-181b mimics (n = 6). Representative images show the differential targeted enhancement values for VCAM-1 expression detected by ultrasound before and after microbubble burst. (J) Quantification of differential targeted enhancement values for VCAM-1 expression in mice injected with miRNA negative control or miR-181b mimics. Data represent mean ± SEM. *P < 0.05.
Figure 3
Figure 3. miR-181b inhibits the activation of the NF-κB signaling pathway.
(A) Luciferase activity of reporters containing either the NF-κB concatemer or VCAM-1 promoter in HUVECs transfected with miRNA negative control or miR-181b mimics and miRNA inhibitor negative control or miR-181b inhibitor after 12 hours treatment with 10 ng/ml of TNF-α. #P < 0.05; *P < 0.01. Values represent mean ± SD; n = 3. (B) p65 staining in HUVECs transfected with miRNA negative control or miR-181b mimics. Thirty-six hours after transfection, cells were treated with 10 ng/ml TNF-α for 60 minutes and processed for immunostaining with antibodies against p65. Cells were stained with DAPI to visualize the nucleus. Cy3-conjugated miRNA negative control was transfected at 3 nM concentration to show transfection efficiency in both groups. Images were acquired by confocal microscopy from 3 independent experiments, and values represent mean ± SD. *P < 0.01. Scale bars: 20 μm. (C) The indicated proteins were detected in cytoplasmic or nuclear fractions prepared from HUVECs transfected with miRNA negative control or miR-181b mimics and treated with 10 ng/ml TNF-α for 1 hour. Densitometry was performed and fold change of p65 and p50 protein expression after normalization is shown below the corresponding band. Quantifications from 3 independent experiments were shown in D, and values represent mean ± SD. *P < 0.05. (E) Western blot analysis of phosphorylated IκBα or IKKβ in HUVECs transfected with miRNA negative control, or miR-181b mimics and treated with 10 μM MG-132 or DMSO for 2 hours followed by 10 ng/ml TNF-α for the indicated times.
Figure 4
Figure 4. miR-181b reduces importin-α3 expression.
(A) Western blot analysis of importin-α1, importin-α3, and importin-α5 in cells transfected with miRNA negative control or miR-181b mimics in the absence or presence of 10 ng/ml TNF-α. Mean ± SD, n = 3. *P < 0.05. (B) Normalized luciferase activity of a reporter containing the 3′ UTR of importin-α3 in cells cotransfected with increasing amounts of pcDNA3.1 empty vector or pcDNA3.1-miR-181b. *P < 0.01. (C) Normalized luciferase activity of a reporter containing the 3′ UTR of importin-α1, importin-α3, importin-α4, and importin-α5 cotransfected with either pcDNA3.1 empty vector or pcDNA3.1-miR-181b. *P < 0.01. (D) Normalized luciferase activity of a reporter containing 3′ UTR of importin-α3, predicted miR-181b–binding sites, or mutated miR-181b–binding sites. The reporter was cotransfected with either pcDNA3.1 empty vector or pcDNA3.1–miR-181b. *P < 0.05. (E) miRNP-IP analysis of enrichment of importin-α3 mRNA in HUVECs transfected with miRNA negative control or miR-181b mimics. *P < 0.01. (F) Luciferase activity of reporters containing the NF-κB concatemer in cells transfected with miRNA negative control or miR-181b mimics in the absence or presence of importin-α3 gene lacking its 3′ UTR. *P < 0.05. (G) Mice were i.v. injected with vehicle (n = 3 mice), miRNA negative control (n = 4 mice), or miR-181b mimics (n = 5 mice) and treated with TNF-α for 4 hours; aortas were harvested for importin-α3 staining. *P < 0.05. Scale bars: 20 μm (insets, 10 μm). (H) Western blot analysis of importin-α3 of lung ECs freshly isolated from mice treated with miRNA negative control or miR-181b mimics. Mean ± SD, n = 3. *P < 0.05. (I) Western blot analysis of importin-α3 of lung ECs freshly isolated from mice treated with miRNA inhibitor negative control or miR-181b inhibitor. Mean ± SD, n = 3. *P < 0.05.
Figure 5
Figure 5. Gene expression profiling in HUVECs transfected with miR-181b and bioinformatics analysis.
(A) Relative gene expression of 24 TNF-α–regulated genes in HUVECs transfected with miRNA negative control or miR-181b mimics, as identified by microarray gene chip assay. Expression is presented as fold change relative to HUVECs transfected with miRNA negative control. Data shown are mean ± SD, n = 4. #, nonsignificant comparison; all other genes examined were significantly reduced by miR-181b overexpression (P < 0.05). (B) Real-time qPCR analysis of the genes listed in A. All genes examined were significantly reduced by overexpression of miR-181b (P < 0.05). (C) HUVECs infected with control virus or Ad-DN-IκBα were treated with TNF-α and harvested for real-time qPCR analysis of the genes listed in A. All genes examined were significantly reduced by Ad-DN-IκBα (P < 0.05). (D) Western blot analysis of CX3CL-1, PAI-1 (gene symbol, SERPINE1), COX-2 (gene symbol, PTGS2), and VCAM-1 in HUVECs transfected with miRNA negative control or miR-181b mimics. Values represent mean ± SD, n = 3. *P < 0.05.
Figure 6
Figure 6. miR-181b reduces EC activation and leukocyte accumulation in LPS-induced lung inflammation/injury.
(A) Mice were i.v. injected with vehicle, miRNA negative control, or miR-181b mimics and treated with or without LPS (40 mg/kg, i.p., serotype 026:B6) for 4 hours; lungs were harvested and stained for H&E, Gr-1, CD45, or VCAM-1 staining. Scale bars: 50 μm (insets, 20 μm). (B) Evaluation of lung injury 4 hours after LPS was determined by lung injury scoring. Each data point represents score from 1 section. n = 4 mice per group, and 3 sections per mouse were scored. *P < 0.05. (C) Quantification of CD45-positive cells. *P < 0.05. (D) Quantification of Gr-1 positive cells. *P < 0.05. (E) Quantification of VCAM-1 expression. *P < 0.05. n = 4 mice per group; values represent mean ± SD (CE). (F) Mice were treated as in A. Lungs were harvested and assessed for MPO activity, and the value of the vehicle group was set to 1. Values represent mean ± SD, n = 6 mice per group. (G and H) Mice were treated as in A, and lungs were harvested for Gr-1 staining. Scale bars: 20 μm. Quantification shows the number of Gr-1–positive cells per mm vessel length. Values represent mean ± SD, n = 4. *P < 0.05. (I) Kaplan-Meier survival curves of: LPS-treated C57BL/6 mice (50 mg per kg, i.p., n = 10 to 11 per group) that were injected i.v. with vehicle (black circles), miRNA negative control (red squares), or miR-181b mimics (blue triangles) 48 hours before, 24 hours before, and 1.5 hours after LPS administration. *P < 0.05, 1-tailed log-rank test.
Figure 7
Figure 7. Systemic delivery of miR-181b inhibits NF-κB activation in vivo.
(A) Mice (n = 3–5 per group) were injected with vehicle, miRNA negative control, or miR-181b 3 times, and lungs were harvested on day 4 after 2 hours of 10 mg/kg LPS (026:B6, i.p.) for immunostaining with anti-p65 (red), anti-CD31 (green), and DAPI (blue). Arrows indicate differential p65 accumulation in nuclei of ECs after treatment. Scale bars: 20 μm (insets, 10 μm). Nuclear p65 was quantified in vascular ECs reflecting vehicle (n = 22 ECs), miRNA negative control (n = 40 ECs), and miR-181b mimics (n = 39 ECs). Mean ± SEM. *P < 0.01. (B) NF-κB luciferase transgenic mice (n = 4 per group) were injected with vehicle, miRNA negative control, or miR-181b as described in A. On day 4, 4 hours after 10 mg/kg LPS (026:B6), lungs were harvested for luciferase activity assay. Mean ± SD. *P < 0.05. (C and D) Real-time qPCR analysis of VCAM-1 or E-selectin. Mean ± SEM. *P < 0.05. (E) Western blot analysis of VCAM-1 in freshly isolated lung ECs from treated mice. Mean ± SEM, n = 2. *P < 0.05. (F) Real-time qPCR analysis of miR-181b expression in lungs after 4 hours LPS. Mean ± SD. *P < 0.01. (G) NF-κB luciferase transgenic mice (n = 6–8 per group) were injected with recombinant adenovirus Ad-GFP or Ad–DN-IκBα, followed by i.v. injection of vehicle, miRNA negative control, or miR-181b as described in A. Lungs were harvested on day 5 after 4 hours of 10 mg/kg LPS (026:B6) for luciferase activity assay and Western blot analysis. Mean ± SD. * P < 0.05.
Figure 8
Figure 8. Inhibition of miR-181b potentiates LPS-induced proinflammatory gene expression in vivo.
(AE) NF-κB transgenic mice (n = 5 per condition) were i.v. injected with vehicle, miRNA inhibitor negative control, or miR-181b inhibitors (2 nmol/injection, 3 injections on consecutive days). Twenty-four hours after the last injection, mice were treated with or without LPS (10 mg/kg) for 4 hours, and lungs were harvested for different assays. (A) Real-time qPCR analysis of miR-181b expression. Mean ± SEM. (B) Western blot analysis of VCAM-1 protein expression. Densitometry was performed, and fold change of protein expression was quantified. Mean ± SEM. (C) Real-time qPCR analysis of VCAM-1 mRNA expression. Mean ± SEM. (D) Real-time qPCR analysis of E-selectin mRNA expression. Mean ± SEM. (E) Luciferase activity in lung lysates. Mean ± SD. (FI) Mice (n = 3–5 per group) were treated as in A. (F) H&E, CD45, Gr-1 staining of lung sections. Scale bars: 50 μm. (G) Evaluation of lung injury 4 hours after LPS was determined by lung injury scoring. Each data point represents a score from 1 section. 2 or 3 sections per mouse were scored. (H) Quantification of CD45-positive cells. Mean ± SD. *P < 0.05. (I) Quantification of Gr-1–positive cells. Mean ± SD.
Figure 9
Figure 9. Circulating miR-181b levels are reduced in plasma from patients with sepsis or sepsis/ARDS.
(A) Circulating miR-181b in either patients with sepsis (n = 26) or control subjects admitted to the ICU without sepsis (n = 16). (B) Circulating miR-181b in patients with sepsis plus sepsis/ARDS (n = 36) compared with control subjects (n = 16). The expression levels of miR-181b were detected by real-time qPCR. Data show mean ± SEM. *P < 0.05.

Comment in

Similar articles

Cited by

References

    1. Aird WC. The role of the endothelium in severe sepsis and multiple organ dysfunction syndrome. Blood. 2003;101(10):3765–3777. doi: 10.1182/blood-2002-06-1887. - DOI - PubMed
    1. Aird WC. Endothelium as a therapeutic target in sepsis. Curr Drug Targets. 2007;8(4):501–507. doi: 10.2174/138945007780362782. - DOI - PubMed
    1. Baker RG, Hayden MS, Ghosh S. NF-kappaB, inflammation, and metabolic disease. Cell Metab. 2011;13(1):11–22. doi: 10.1016/j.cmet.2010.12.008. - DOI - PMC - PubMed
    1. Gareus R, et al. Endothelial cell-specific NF-kappaB inhibition protects mice from atherosclerosis. Cell Metab. 2008;8(5):372–383. doi: 10.1016/j.cmet.2008.08.016. - DOI - PubMed
    1. Guerci B, Bohme P, Kearney-Schwartz A, Zannad F, Drouin P. Endothelial dysfunction and type 2 diabetes. Part 2: altered endothelial function and the effects of treatments in type 2 diabetes mellitus. Diabetes Metab. 2001;27(4 pt 1):436–447. - PubMed

Publication types

MeSH terms