. 2012 Jun;122(6):2114-29.
doi: 10.1172/JCI62279. Epub 2012 May 24.

mTORC1 is essential for leukemia propagation but not stem cell self-renewal

Affiliations

mTORC1 is essential for leukemia propagation but not stem cell self-renewal

Takayuki Hoshii et al. J Clin Invest. 2012 Jun.

Abstract

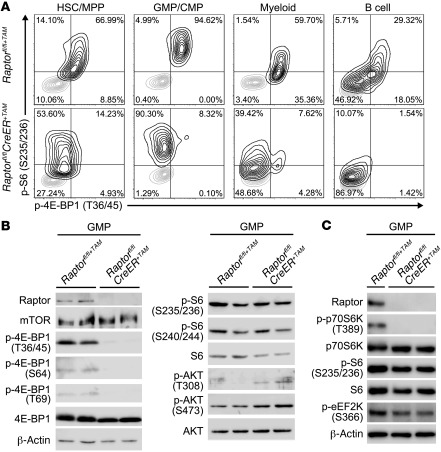
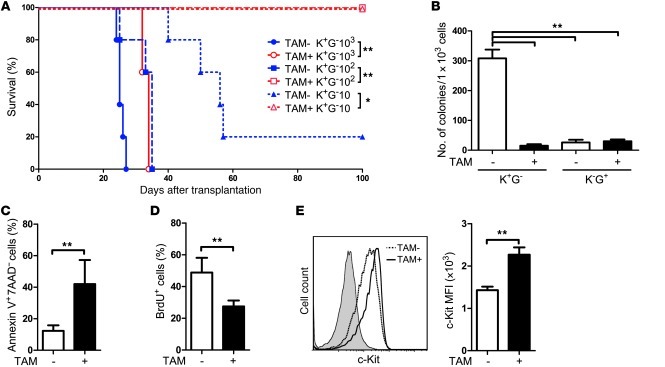
Although dysregulation of mTOR complex 1 (mTORC1) promotes leukemogenesis, how mTORC1 affects established leukemia is unclear. We investigated the role of mTORC1 in mouse hematopoiesis using a mouse model of conditional deletion of Raptor, an essential component of mTORC1. Raptor deficiency impaired granulocyte and B cell development but did not alter survival or proliferation of hematopoietic progenitor cells. In a mouse model of acute myeloid leukemia (AML), Raptor deficiency significantly suppressed leukemia progression by causing apoptosis of differentiated, but not undifferentiated, leukemia cells. mTORC1 did not control cell cycle or cell growth in undifferentiated AML cells in vivo. Transplantation of Raptor-deficient undifferentiated AML cells in a limiting dilution revealed that mTORC1 is essential for leukemia initiation. Strikingly, a subset of AML cells with undifferentiated phenotypes survived long-term in the absence of mTORC1 activity. We further demonstrated that the reactivation of mTORC1 in those cells restored their leukemia-initiating capacity. Thus, AML cells lacking mTORC1 activity can self-renew as AML stem cells. Our findings provide mechanistic insight into how residual tumor cells circumvent anticancer therapies and drive tumor recurrence.


Figures

Figure 1
Figure 1. Conditional deletion of Raptor causes abnormalities in the hematopoietic organs of adult mice.
(A) Targeting strategy to create the floxed Raptor (Raptorfl) allele. The targeting vector includes a FRT-flanked neo cassette (PGK promoter–driven neomycin resistance gene) for positive selection and a diphtheria toxin A (DTA) gene for negative selection. Raptor exon 2 is flanked by loxP sites. The neo cassette of the Raptorfl;neo allele was removed by crossing Raptorfl;neo mice with CAG-FLP mice. Exon 2 was removed by Cre recombinase to give the RaptorΔ allele. Probes for Southern blotting (5ι probe, Neo) and primers for PCR (a, b, c) are indicated. E, EcoRI; S, SacI. (B) Body weight of Raptorfl/fl+TAM (control) and Raptorfl/flCreER+TAM (Raptor-deficient) mice. Data shown are the mean body weight ± SD (n = 5). (C) Survival of control and Raptor-deficient mice. P = 0.0003 (log-rank test; n = 15). (D) Decreased numbers of BM-MNCs. Data shown are the mean BM-MNC number ± SD in hind legs of control and Raptor-deficient mice at 10 days post-TAM (n = 12). (E) Organ weights of control and Raptor-deficient mice at 10 days post-TAM. Data shown are the mean relative organ weight (% of total body weight) ± SD (n = 5). *P < 0.05, **P < 0.01 (Student’s t test).
Figure 2
Figure 2. Deletion of Raptor impairs granulocyte and B cell development but does not alter progenitor cell survival or proliferation.
(A) Flow cytometric analysis of BM-MNCs from control and Raptor-deficient mice. Images represent data for HSCs/MPPs (K+S+L), CMPs (Linc-Kit+Sca-1FcgRIII/IICD34+), GMPs (Linc-Kit+Sca-1FcgRIII/II+CD34+), MEPs (Lin-c-Kit+Sca-1FcgRIII/IICD34), CLPs (IL-7Rα+Lin-c-KitmidSca-1mid), myeloid lineage cells (Mac-1/Gr-1), and B lineage cells (B220/IgM). Values are the mean percentage ± SD of the specified subpopulation among total BM-MNCs (n = 4). (B) Apoptosis. BM-MNCs from control and Raptor-deficient mice were subjected to TUNEL staining, and the indicated subpopulations were analyzed by flow cytometry. Data shown are the mean ± SD of TUNEL+ cells (n = 3). (C) Cell cycle. BrdU was injected i.p. into mice 2 hours prior to sacrifice. The indicated BM cell populations were stained with an anti-BrdU Ab and analyzed by flow cytometry. Data are the mean percentage ± SD of BrdU+ cells (n = 3). (D and E) Colony-forming ability. K+S+L cells (D) and GMP cells (E) were isolated from BM-MNCs of control and Raptor-deficient mice and cultured for 10 days in semisolid medium. Data are the mean colony number ± SD (n = 3). Colony diameters are indicated. (F) Flow cytometric analysis of the differentiation into myeloid and B lineage cells of control and Raptor-deficient K+S+L cells cultured on stromal cells. Raptorfl/fl or Raptorfl/flCreER K+S+L cells were cultured on a layer of OP-9 stromal cells for 2 weeks in the presence or absence of TAM. Data shown are the percentage ± SD of B220+ Mac-1+ cells among CD45+-gated cells (n = 3). One flow cytometric analysis representative of 3 independent experiments is shown. *P < 0.05, **P < 0.01 (Student’s t test).
Figure 3
Figure 3. Deletion of Raptor has differential effects on phosphorylation of mTORC1 effectors in different hematopoietic cell contexts.
(A) Flow cytometric analysis of intracellular p-S6 and p–4E-BP1. Data shown are levels of p-S6 (S235/236) and p–4E-BP1 (T36/45) in the indicated BM MNC subpopulations from control and Raptor-deficient mice. Cells were collected 10 days after the last injection of TAM. (B) Phosphorylation of mTOR signaling pathway proteins in GMPs. Lysates of GMPs isolated from control and Raptor-deficient mice were immunoblotted to detect the indicated proteins. β-Actin was used as loading control. Results are representative of at least 3 independent trials. (C) Phosphorylation of p70S6K and its substrates in GMPs. Lysates of GMPs isolated from control and Raptor-deficient mice were immunoblotted to detect the indicated proteins. β-Actin was used as loading control. Results are representative of at least 3 independent trials.
Figure 4
Figure 4. Generation of a Raptor-deficient murine AML model.
(A) Experimental design for a Raptor-deficient murine AML model. (B and C) Survival of AML mice. Raptorfl/fl AML mice (B) and Raptorfl/flCreER AML mice (C) were established as illustrated in A. BM-MNCs from these animals were transplanted into a fresh set of recipients (along with rescue cells), and these animals were treated with oil diluent as the control (TAM–) or with TAM (TAM+) to generate the indicated control and Raptor-deficient AML mice. P value were determined by the log-rank test. (D) Number of wbc in PB. PB samples were obtained from the Raptorfl/flCreER AML mice at 14 days after control or TAM treatment. Data shown are mean number ± SD (TAM–, n = 6; TAM+ n = 9). The horizontal dotted line is the mean value of the number of wbc in normal adult mice (8 weeks old, n = 5). (E) Flow cytometric analyses of AML cells in PB. PB samples were obtained from the Raptorfl/flCreER AML mice at 14 days after control or TAM treatment. Representative data are shown for GFP/c-Kit expression in PB-MNCs. Values in panels are the mean percentage ± SD for the indicated subpopulations (n = 4). **P < 0.01 (Student’s t test).
Figure 5
Figure 5. Undifferentiated AML cells are resistant to loss of mTORC1 activity.
The Raptorfl/flCreER AML mice were analyzed 14 days after control or TAM treatment. (A and B) Number of BM-MNCs in BM (A: TAM–, n = 6; TAM+, n = 5) and of platelets (PLT) in PB (B: TAM–, n = 6; TAM+, n = 9). Data are mean number ± SD of the indicated hematopoietic cell type. Horizontal dotted lines are mean values of the indicated hematopoietic parameters in normal adult mice (8 weeks old, n = 5). (C and D) Flow cytometric analyses of AML cells in BM. Representative data are shown for GFP/c-Kit expression in BM-MNCs (C) and for c-Kit/Gr-1 expression in GFP+-gated BM-MNCs (D). Values are the mean percentage ± SD for the indicated subpopulations (C, n = 10; D, n = 3). (E) Absolute numbers of K+G and KG+ cells in the hind legs of the Raptorfl/flCreER AML mice (TAM– or TAM+). Data shown are the values for individual mice (n = 10 per group). Horizontal lines are mean values. (F) Morphological analysis of AML cells. GFP+ cells from the BM of AML mice were stained with May-Grünwald/Giemsa. Data are the mean percentage ± SD of AML cells containing segmented nuclei (n = 5). Right panels show representative images of GFP+ cells. Scale bars: 10 μm. Arrowheads indicate AML cells with segmented nuclei (differentiated AML cells). (G) Cell cycle. BrdU was injected i.p. into AML mice 2 hours prior to sacrifice. AML cells were harvested, stained with an anti-BrdU Ab, and analyzed by flow cytometry. Data are the mean percentage ± SD of BrdU+ cells in the indicated AML cell subpopulations (n = 5). (H) Apoptosis. Data shown are the mean percentage ± SD of Annexin V+7AAD cells in the indicated AML cell subpopulations (n = 5). *P < 0.05, **P < 0.01 (Student’s t test).
Figure 6
Figure 6. 4E-BP1–independent cell growth of Raptor-deficient AML cells.
(A) Phosphorylation of mTOR signaling pathway proteins. Lysates were prepared from the indicated AML cell subpopulations and immunoblotted to detect the indicated proteins. (B) Flow cytometric analysis of cell size. Left: Representative histogram shows forward scatter (FSC) of K+G AML cells from the mice in A. Right: Quantification. All FSC values were normalized to the mean value (dotted line) obtained for K+G AML cells from control AML mice in 10 independent experiments. Data shown are mean normalized FSC values ± SD (n = 10). (C and D) Amount of protein in K+G AML cells. Lysates were prepared from K+G AML cells 14 days post-TAM. Proteins were quantified with a BCA protein assay (C), and SDS-PAGE was performed, followed by silver staining, to visualize protein levels (D). Data in C are the mean ± SD of the amount of protein (ng) in 1 × 10⁴ K+G AML cells (n = 8). (E) 7-methyl GTP pull-down assay. Lysates were prepared from the indicated AML cell subpopulations, incubated with 7-methyl GTP-Sepharose beads, washed, and immunoblotted to detect the indicated proteins. Numbers below the panel are the ratios of the intensity of the 4E-BP1 and eIF4E protein band signals. *P < 0.05, **P < 0.01 (Student’s t test).
Figure 7
Figure 7. Raptor-deficient AML stem cells show defective leukemia-initiating capacity.
(A) Limiting dilution transplantation assay. The indicated numbers of K+G AML cells from the mice 14 days after control or TAM treatment were transplanted into lethally irradiated recipients along with WT BM-MNCs (rescue cells), and survival was monitored (n = 5/group). *P < 0.05, **P < 0.01 (log-rank test). (B) Colony-forming ability of AML cells. KG+ and K+G AML cells were isolated from Raptorfl/flCreER AML mice 14 days after control or TAM treatment and cultured in semisolid medium for 7 days. Data are the mean colony numbers ± SD (n = 3). (C) Apoptosis of K+G AML cells after 12 hours of stimulation with the cytokines SCF, IL-3, and IL-6. Data shown are the mean percentage ± SD of Annexin V+7AAD cells (n = 8). (D) Cell cycle of K+G AML cells after 12 hours of stimulation with the same set of cytokines. Data shown are the mean percentage ± SD of BrdU+ cells (n = 8). (E) Expression level of c-Kit on K+G AML cells after 12 hours of cytokine stimulation. Representative histograms are shown in the left panel. Shaded histogram: nonstained AML cells; dotted line: Raptorfl/flCreER–TAM AML cells; solid line: Raptorfl/flCreER+TAM AML cells. Data in the right panel are the mean percentage ± SD of MFI of c-Kit (n = 3). For B–E, **P < 0.01 (Student’s t test).
Figure 8
Figure 8. mTORC1-independent long-term survival of AML cells in vivo.
(A) Presence of AML cells surviving long-term in BM. 10–400 K+G cells from Raptorfl/flCreER+TAM AML mice were transplanted into recipients, and GFP expression was evaluated in BM-MNCs 100 days after transplantation. Data shown are the percentages of GFP+ cells among total BM-MNCs. Horizontal lines are the mean percentages of GFP+ cells in cases where GFP+ cells were present. Numbers of mice possessing GFP+ cells/total number of recipients are shown at the bottom of the panel. (B) Morphological analysis of RaptorΔ/Δ AML cells. GFP and GFP+ cells were isolated from BM-MNCs of recipients possessing GFP+ cells. Cells were stained with May-Grünwald/Giemsa. Scale bars: 50 μm. (C) Flow cytometric characterization of the AML cells in A. Results of two representative analyses are shown. (D) Phosphorylation of mTOR signaling pathway proteins in RaptorΔ/Δ (long-term Raptor-deficient) AML cells. Immunoblotting to detect the indicated proteins was performed on lysates of GFP+ K+G cells isolated from the following mice: lanes 1 and 6, Raptorfl/flCreER–TAM AML (fl/fl; TAM–, control); lane 2, Raptorfl/flCreER+TAM AML at 14 days post-TAM (fl/fl; TAM+); lanes 3–5, RaptorΔ/Δ AML (Δ/Δ). (E and F) Analysis of apoptosis and cell cycle in RaptorΔ/Δ AML cells. The apoptosis rate (E) and proportion of cells in the cell cycle (F) of the indicated subpopulations from Raptorfl/flCreER–TAM AML cells (fl/fl; TAM–, control) and RaptorΔ/Δ AML cells (Δ/Δ) were evaluated by using Annexin V/7AAD staining and BrdU incorporation, respectively. Data shown in E and F are the mean ± SD of Annexin V+7AAD cells (n = 4) and BrdU+ cells (n = 4), respectively. **P < 0.01 (Student’s t test).
Figure 9
Figure 9. Restoration of leukemia-initiating capacity of long-term Raptor-deficient AML stem cells by mTORC1 reactivation.
(AC) Leukemia development upon restoration of Raptor. Recipient mice were transplanted with BM-MNCs (including RaptorΔ/Δ AML cells) infected with either control retrovirus expressing KO alone or retrovirus expressing hRAPTOR (hRAPTOR/KO). Survival (A), total number of wbc in PB (B), and the mean percentage ± SD of GFP+ cells in PB (C) of these recipients were analyzed 26–35 days after transplantation. For A, the P value was determined by the log-rank test. (D) Flow cytometric analysis of RaptorΔ/Δ+hRAPTOR/KO AML cells. Representative data for GFP/KO fluorescence (left) and c-Kit/Gr-1 expression (right) of BM-MNCs from the recipient mice in AC are shown. Values are the mean percentage ± SD of the indicated subpopulations (n = 7). (E) Phosphorylation of mTOR signaling pathway proteins in RaptorΔ/Δ+hRAPTOR/KO AML cells. Immunoblotting to detect the indicated proteins was performed on lysates of the indicated AML cell subpopulations prepared from the following mice: lane 1, Raptorfl/flCreER–TAM (TAM-, control); lane 2, RaptorΔ/Δ; lanes 3–5, RaptorΔ/Δ+hRAPTOR/KO (case 1); lanes 6–8, RaptorΔ/Δ+hRAPTOR/KO (case 2). (F) Colony-forming ability of RaptorΔ/Δ+hRAPTOR/KO AML cells. K+G or KG+ (GFP+KO+) subpopulations isolated from among RaptorΔ/Δ+hRAPTOR/KO AML cells were cultured in semisolid medium for 7 days. Data are the mean colony number ± SD (n = 3). (G) The survival of recipient mice transplanted with 100 K+G RaptorΔ/Δ+hRAPTOR/KO AML cells was monitored (n = 23). (H) Model of the role of mTORC1 in AML stem cell regulation. See text for explanation. **P < 0.01 (Student’s t test).

Comment in

References

    1. Ma XM, Blenis J. Molecular mechanisms of mTOR-mediated translational control. Nat Rev Mol Cell Biol. 2009;10(5):307–318. - PubMed
    1. Ramanathan A, Schreiber SL. Direct control of mitochondrial function by mTOR. Proc Natl Acad Sci U S A. 2009;106(52):22229–22232. doi: 10.1073/pnas.0912074106. - DOI - PMC - PubMed
    1. Cunningham JT, Rodgers JT, Arlow DH, Vazquez F, Mootha VK, Puigserver P. mTOR controls mitochondrial oxidative function through a YY1-PGC-1alpha transcriptional complex. Nature. 2007;450(7170):736–740. doi: 10.1038/nature06322. - DOI - PubMed
    1. Rabinowitz JD, White E. Autophagy and metabolism. Science. 2010;330(6009):1344–1348. doi: 10.1126/science.1193497. - DOI - PMC - PubMed
    1. Alessi DR, Pearce LR, Garcia-Martinez JM. New insights into mTOR signaling: mTORC2 and beyond. Sci Signal. 2009;2(67):pe27. doi: 10.1126/scisignal.267pe27. - DOI - PubMed

Publication types

MeSH terms

Substances