. 2012 May 9;485(7399):471-7.
doi: 10.1038/nature11057.

Brain-wide neuronal dynamics during motor adaptation in zebrafish

Affiliations

Brain-wide neuronal dynamics during motor adaptation in zebrafish

Misha B Ahrens et al. Nature. .

Abstract

A fundamental question in neuroscience is how entire neural circuits generate behaviour and adapt it to changes in sensory feedback. Here we use two-photon calcium imaging to record the activity of large populations of neurons at the cellular level, throughout the brain of larval zebrafish expressing a genetically encoded calcium sensor, while the paralysed animals interact fictively with a virtual environment and rapidly adapt their motor output to changes in visual feedback. We decompose the network dynamics involved in adaptive locomotion into four types of neuronal response properties, and provide anatomical maps of the corresponding sites. A subset of these signals occurred during behavioural adjustments and are candidates for the functional elements that drive motor learning. Lesions to the inferior olive indicate a specific functional role for olivocerebellar circuitry in adaptive locomotion. This study enables the analysis of brain-wide dynamics at single-cell resolution during behaviour.


Figures
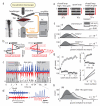
Figure 1
Figure 1
Experimental setup, and fictive motor adaptatation. a. Schematic of the setup. Inset:. A paralyzed larva supported by pipettes, two of which are recording pipettes. b. Illustration of the virtual motor adaptation assay. Left: trajectory of a fish executing one swim bout against a water current (black trajectory) in the presence of a visual surround (red). Right: simulation of this behavior in the virtual environment, in which the visual surround is moved and the fish is stationary. The visual surround is accelerated backward when a fictive swim occurs. Dashed red: trajectory that would occur if the feedback gain were higher. c. Fictive motor adaptation. Fictive swim vigor (red and blue for left and right channel respectively) and stimulus velocity (black) plotted over time. High and low feedback gain epochs shown in gray and white. d. Example fictive swim bout (left) and corresponding processed trace (right). e. Assay to probe sensorimotor adaptation and motor memory formation. f. Power per swim (area under the processed fictive signal) as a function of swim bout number during adaptation phase I (N=5 fish). g. Average power as a function of swim bout number during phase I. Top inset: relative swim bout power as a function of time, bottom inset: average time of swim bouts for low gain (light) and high gain (dark) conditions. h. Histogram of relative power of the first swim bout in phase III after either low gain (light) or high gain (dark) in phase I. Bout power is significantly higher after a low gain epoch than after a high gain epoch.
Figure 2
Figure 2
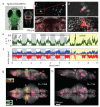
Functional imaging during adaptive motor control in larval zebrafish. a. Micrograph of a larval zebrafish with panneuronal GCaMP2 expression. Area scanned in c-e indicated by square. b. Automatic localization of imaged plane on a reference brain (Methods 3). c. Detected signal (top, Methods 3) overlaid on anatomical image (bottom). Red circle indicates neuron of interest selected in d and e. d. Correlational map (top, correlation coefficient of ROI signal with all pixels in the red rectangle, Methods 3) overlaid on anatomy (bottom). Example neuron is hand-segmented. e. Fluorescence time series of example neuron. Gray areas: high feedback gain, white areas: low gain. Yellow: open-loop stimulus playback from the previous three minutes (black bar). f. Fictive locomotor drive is boosted during low gain periods. The fluorescence time series in e is strongly correlated with the fictive swim signal (yellow replay period: ∣ccFM = 0.58∣ > ccFF = 0.21). g. Areas in the brain with activity strongly correlating to fictive locomotion (∣ccFM∣ > 0.5; N is the number of sites satisfying the criterion). Green dots show location of identified sites; magenta-yellow gradient indicates spatial uncertainty (caused by mapping 32 brains to one reference brain), scaled by sampling density. Units found in (1) areas in hindbrain including the inferior olive, (2) cerebellum and anterior hindbrain, (3) in the nucMLF and pretectum area, (4) forebrain. h. Areas correlating with visual stimulation but not motor output (ccFF > ∣ccFM∣, ccFF > 0.2; Methods 5). (1) Hindbrain, (2) cerebellum, (3) tectum, (4) pretectum, (5) forebrain.
Figure 3
Figure 3
Low dimensional representation of neural network dynamics. a. Projection of activity of all detected units from all fish onto the first three principal components derived from principal components analysis. Circles represent intervals of three seconds. b. First two temporal principal components (TPCs). TPC1 shows elevated activity during low gain periods; TCP2 shows transient activity after a gain decrease followed by a slow dip. (See Suppl. Figs. S20,S21). c. Top view of a (α: transient dynamics after switch to low gain, β: steady-state during low gain, γ: transient dynamics after switch to high gain, δ: steady-state during high gain). d. Speed through phase space over one low-high gain period, showing accelerated trajectory speed after gain changes.
Figure 4
Figure 4
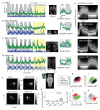
Four types of neural dynamics during adaptive motor control. a. Motor related activity in a single neuron in the forebrain, outlined in red in left inset. White: low gain periods, gray: high gain periods, yellow: stimulus replay period from the previous three minutes (starts at dashed red), blue: fictive swim signals, green: single-neuron fluorescence signal. All scale bars, 50% ΔF/F. Left inset: Imaged plane, right inset: fluorescence trace in green and behavior in blue, both averaged over six gain repetitions, with standard errors in light color. b. Transient activity after decreases in gain in a neuron in the deep cerebellum. c. Transient activity after increases in gain in a visually-driven neuron in the tectum. d. Motor-off activity in a neuron in the dorsal hindbrain. Inset below: anatomical locations of recordings in a-d. e. Population data for neuron types as in a-d, with normalized averages in black overlaid on heat map of individual traces. f. Histograms of ccFM and ccFF. Neurons in the ‘motor’ and ‘gain-down’ groups are more related to locomotion; neurons in the ‘gain-up’ group are more responsive to visual input, and the ‘motor-off’ group is mixed. The empty square in the center represents values of ccFM and ccFF that are indistinguishable from those arising from noise (see Suppl. Figs. S17,S18). g. Control for false positives. When fluorescence traces are scrambled by cutting at 16 random time points and rearranging, the number of detected units falls by a factor of 8.1 on average, indicating that detected units are not a result of false positives (chance level is at 1). h. Scatter plot of motor coefficient (average normalized fluorescence during seconds 10-30 of low gain period) versus gain-down coefficient (average fluorescence during seconds 1-8 of low gain period) showing segregation with partial overlap of motor and gain-down units. i-k. Similar scatter plots for other coefficients; k shows that no detected neuron codes for both upward and downward gain changes: transient neuronal activity is specific to direction of gain change.
Figure 5
Figure 5
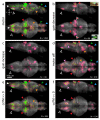
Anatomical locations of neurons and neuropil regions classified by statistical criteria described in the text, over 32 fish, normalized by sampling density (see also Suppl. Figs. S9-12). Green dots show location of identified sites; magenta-yellow gradient indicates confidence interval, scaled by sampling density (Methods). a. ‘Motor’ units, b. gain decrease units, c. gain increase, d. motor-off, e. sites with activity relating to locomotion as measured during ‘replay’ by ccFM > 0.4, and f. sites anticorrelating with locomotion as measured by ccFM < −0.25. Black arrows: inferior olive, red: cerebellum, red with white outline: deep lateral cerebellum, yellow: ventral hindbrain nearby cerebellum, white: posterior hindbrain, pink: dorsal posterior hindbrain, orange: nucMLF and pretectum area, green: habenula, blue: pallium.
Figure 6
Figure 6
Effect of inferior olive lesions on visually-induced motor adaptation. a. Histogram of power per swim bout, pre-lesion, for 6 fish, in the high- and low-gain conditions. Difference in mean power per fish is significant before lesion (p<0.001, t-test on means of N=6 fish). b. Post-lesion histogram. The I.O. was lesioned in approximately 60 locations with an infrared laser. The fish still performed the optomotor response (Suppl. Fig. S24), but did not anymore significantly adjust the power of the swim bouts to the external feedback gain (p=0.09, same 6 fish). c. Lesions of similar size in the dorsal anterior hindbrain did not impair motor adaptation (p<0.001 pre-lesion for N=5 fish, p=0.01 post-lesion, Suppl. Figs. S23, S28). These results suggest that the inferior olive is a necessary component of the circuit driving motor adaptation.

Comment in

References

    1. Wall PD, Freeman J, Major D. Dorsal horn cells in spinal and in freely moving rats. Experimental Neurology. 1967 Dec;19(4):519–29. - PubMed
    1. Flusberg BA, Nimmerjahn A, Cocker ED, Mukamel EA, Barretto RPJ, Ko TH, Burns LD, Jung JC, Schnitzer MJ. High-speed, miniaturized fluorescence microscopy in freely moving mice. Nature Methods. 2008 Nov;5(11):935–8. - PMC - PubMed
    1. Naumann EA, Kampff AR, Prober DA, Schier AF, Engert F. Monitoring neural activity with bioluminescence during natural behavior. Nat Neurosci. 2010 Apr;13(4):513–20. - PMC - PubMed
    1. Dombeck DA, Harvey CD, Tian L, Looger LL, Tank DW. Functional imaging of hippocampal place cells at cellular resolution during virtual navigation. Nat Neurosci. 2010 Nov;13(11):1433–40. - PMC - PubMed
    1. Maimon G, Straw AD, Dickinson MH. Active flight increases the gain of visual motion processing in drosophila. Nat Neurosci. 2010 Mar;13(3):393–9. - PubMed

Publication types