. 2012 May 23;485(7399):482-5.
doi: 10.1038/nature11120.

Tunable ion-photon entanglement in an optical cavity

Affiliations

Tunable ion-photon entanglement in an optical cavity

A Stute et al. Nature. .

Abstract

Proposed quantum networks require both a quantum interface between light and matter and the coherent control of quantum states. A quantum interface can be realized by entangling the state of a single photon with the state of an atomic or solid-state quantum memory, as demonstrated in recent experiments with trapped ions, neutral atoms, atomic ensembles and nitrogen-vacancy spins. The entangling interaction couples an initial quantum memory state to two possible light-matter states, and the atomic level structure of the memory determines the available coupling paths. In previous work, the transition parameters of these paths determined the phase and amplitude of the final entangled state, unless the memory was initially prepared in a superposition state (a step that requires coherent control). Here we report fully tunable entanglement between a single (40)Ca(+) ion and the polarization state of a single photon within an optical resonator. Our method, based on a bichromatic, cavity-mediated Raman transition, allows us to select two coupling paths and adjust their relative phase and amplitude. The cavity setting enables intrinsically deterministic, high-fidelity generation of any two-qubit entangled state. This approach is applicable to a broad range of candidate systems and thus is a promising method for distributing information within quantum networks.


Figures
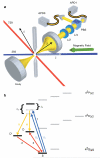
Figure 1
Figure 1. Experimental apparatus and entanglement sequence
a, An ion is confined in a Paul trap (indicated by two endcaps) at the point of maximum coupling to a high-finesse cavity. A 393-nm laser generates atom-photon entanglement, characterized using a 729-nm laser. Photons’ polarization exiting the cavity is analyzed using half- and quarter-waveplates (L/2, L/4), a polarizing beamsplitter cube (PBS), and fiber-coupled avalanche photodiodes (APD0, APD1). b, A bichromatic Raman pulse with Rabi frequencies Ω1, Ω2 and detunings Δ1, Δ2 couples |S〉 to states |D〉 and |D′〉 via two cavity modes H and V (1), generating a single cavity photon. To read out entanglement, |D′〉 is mapped to |S〉 (2), and coherent operations on the S – D transition (3) prepare the ion for measurement.
Figure 2
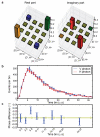
Figure 2. Quantum state tomography of the joint ion-photon state, containing ~ 40, 000 events
a, Real and imaginary parts of all density matrix elements for Raman phase φ = 0.25, from which a fidelity F = 97.4(2) % is calculated. Colors for the density matrix elements correspond to those used in Figs. 3a and 4a. b, Temporal pulse shape of H and V cavity photons. Error bars represent one s.d. based on Poissonian photon statistics. c, Phase of the ion-photon state vs. photon-detection time. Arrows indicate time-bin intervals of the tomography data. Error bars represent one s.d. (see Methods).
Figure 3
Figure 3. State tomography as a function of Raman phase (~ 340, 000 events)
a, Re(ρ14) (blue circles) and Im(ρ14) (red diamonds) as a function of Raman phase. Errorbars are smaller than the size of the symbols. Each value is extracted from a full state tomography of ρ as in Fig 2a. Both curves are fitted simultaneously, with phase offset constrained to π/2. The fit contrast is 95.6(4)%. b, Fidelities of the eight states, with a dashed line indicating the mean value. Error bars represent one s.d. (see Methods).
Figure 4
Figure 4. State tomography for three values of amplitude cos α
a, The density matrix elements ρ11 (orange squares) and ρ44 (green triangles) are plotted for the three target amplitudes cosα={12,13,18}. Errorbars are smaller than the size of the symbols. Solid lines represent the amplitudes of the target states. b, The corresponding fidelities are F = {96.3(3), 96.8(3), 98.0(4)}. A dashed line indicates the mean value. Error bars represent one s.d. (see Methods).

References

    1. Cirac JI, Zoller P, Kimble HJ, Mabuchi H. Quantum state transfer and entanglement distribution among distant nodes in a quantum network. Phys. Rev. Lett. 1997;78:3221–3224.
    1. Kimble HJ. The quantum internet. Nature. 2008;453:1023–1030. - PubMed
    1. Blinov BB, Moehring DL, Duan LM, Monroe C. Observation of entanglement between a single trapped atom and a single photon. Nature. 2004;428:153–157. - PubMed
    1. Olmschenk S, et al. Quantum teleportation between distant matter qubits. Science. 2009;323:486–489. - PubMed
    1. Volz J, et al. Observation of entanglement of a single photon with a trapped atom. Phys. Rev. Lett. 2006;96:030404. - PubMed

Publication types