. 2012 Oct;27(10):2075-84.
doi: 10.1002/jbmr.1665.

Intermittent parathyroid hormone administration converts quiescent lining cells to active osteoblasts

Affiliations

Intermittent parathyroid hormone administration converts quiescent lining cells to active osteoblasts

Sang Wan Kim et al. J Bone Miner Res. 2012 Oct.

Abstract

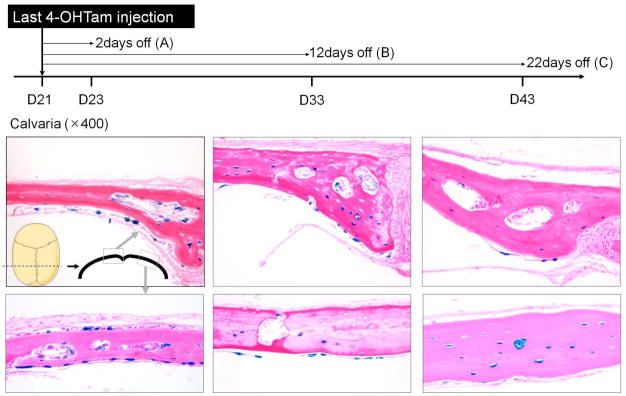
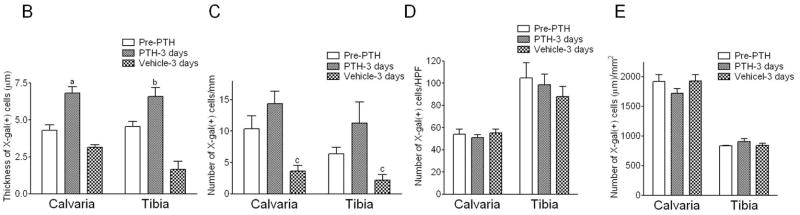
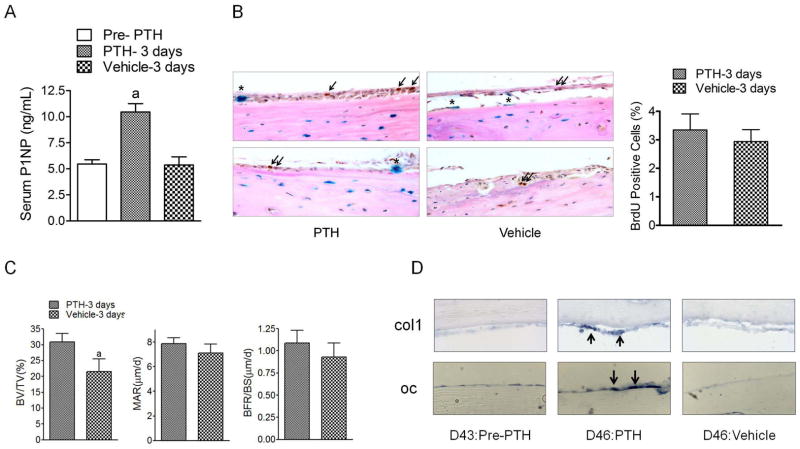
Intermittent administration of parathyroid hormone (PTH) increases bone mass, at least in part, by increasing the number of osteoblasts. One possible source of osteoblasts might be conversion of inactive lining cells to osteoblasts, and indirect evidence is consistent with this hypothesis. To better understand the possible effect of PTH on lining cell activation, a lineage tracing study was conducted using an inducible gene system. Dmp1-CreERt2 mice were crossed with ROSA26R reporter mice to render targeted mature osteoblasts and their descendents, lining cells and osteocytes, detectable by 5-bromo-4-chloro-3-indolyl-β-d-galactopyranoside (X-gal) staining. Dmp1-CreERt2(+):ROSA26R mice were injected with 0.25 mg 4-OH-tamoxifen (4-OHTam) on postnatal days 3, 5, 7, 14, and 21. The animals were euthanized on postnatal day 23, 33, or 43 (2, 12, or 22 days after the last 4-OHTam injection). On day 43, mice were challenged with a subcutaneous injection of human PTH (1-34, 80 µg/kg) or vehicle once daily for 3 days. By 22 days after the last 4-OHTam injection, most X-gal (+) cells on the periosteal surfaces of the calvaria and the tibia were flat. Moreover, bone formation rate and collagen I(α1) mRNA expression were decreased at day 43 compared to day 23. After 3 days of PTH injections, the thickness of X-gal (+) cells increased, as did their expression of osteocalcin and collagen I(α1) mRNA. Electron microscopy revealed X-gal-associated chromogen particles in thin cells prior to PTH administration and in cuboidal cells following PTH administration. These data support the hypothesis that intermittent PTH treatment can increase osteoblast number by converting lining cells to mature osteoblasts in vivo.


Conflict of interest statement

All authors state that they have no conflicts of interest.

Figures

Figure 1
Figure 1. Experimental protocols
Dmp1-CreERt2:ROSA26R mice were injected with 0.25 mg 4-OHTam on postnatal day 3, 5, 7, 14 and 21. To evaluate the fate of mature osteoblasts in vivo, animals were sacrificed on postnatal day 23, 33 or 43 (2, 12 or 22 days after the last 4-OHTam treatment), as well as on day 46 to evaluate the actions of PTH administration.
Figure 2
Figure 2. Tracing of LacZ+ osteoblast descendents on the periosteal surface of the calvaria of Dmp1-CreERt2:ROSA26R mice
X-gal staining was performed at 2 days (A; D23), 12 days (B; D33) and 22 days (C; D43) after the last 4-OHTam injection. Each panel represents a section from a different mouse. The panels represent sections from four mice at the three time points indicated. The number (D) and thickness (E) of X-gal (+) descendents of osteoblasts significantly decreased over time after withdrawal of 4-OHTam. The actual number of X-gal (+) osteocytes (F) did not change but the density of X-gal (+) osteocytes (G) significantly decreased over time after withdrawal of 4-OHTam. The mean cell thickness and number were determined in 6 comparable sections, viewing 8–16 fields/section under 400× from six mice per each group. Data are expressed as mean ± SEM, a: p < 0.01 versus 2 days, b: p < 0.05 versus 2 days, c: p < 0.01 versus 12 days. Dynamic histomorphometric analysis of calcein-labeled calvaria sections and in situ hybridization analysis indicated that bone formation rate (H) and col1 mRNA expression (I) significantly decreased at day 43 compared to at day 23 (The arrows indicate periosteal surface). Data are representative of experiments performed on sections from three mice for each group. Data are expressed as mean ± SEM, a: p < 0.05 versus 2 days
Figure 3
Figure 3. Effects of PTH on LacZ+ osteoblast descendents on the periosteal surface of the calvaria of Dmp1-CreERt2:ROSA26R mice
(A) X-gal staining was performed at 22 days (D43:Pre-PTH) after the last 4-OHTam injection, or animals were injected with PTH (80 μg/kg/d) (D46:PTH) or vehicle (D46:vehicle) for 3 days after day 43. Data are representative of experiments performed on sections from eight mice for each group. Quantitative analysis of the thickness (B) and number (C) of X-gal (+) cells before (pre-PTH) and after 3 days of PTH or vehicle treatment. Data are expressed as mean ± SEM, a: p < 0.01 versus pre-PTH or vehicle, b: p < 0.05 versus pre-PTH or vehicle, c: p < 0.01 versus pre-PTH or PTH. Quantitative analysis of the actual number (D) and density (E) of X gal (+) osteocytes before and after PTH or vehicle treatment. The mean cell thickness and number were determined in 6 comparable sections, viewing 8–16 fields/section under 400× from eight mice per each group.
Figure 4
Figure 4. The effect of PTH on BrdU incorporation and osteogenic activity
(A) The levels of serum P1NP for Dmp1-CreERt2:ROSA26R mice receiving intermittent PTH or vehicle treatment for 3 days. Data are expressed as mean ± SEM, n = 5; a: p < 0.01 versus pre-PTH or vehicle treatment after the last 4-OHTam treatment. (B) BrdU incorporation analysis for Dmp1-CreERt2:ROSA26R mice receiving intermittent PTH or vehicle treatment for 3 days. BrdU staining of paraffin sections of the calvaria was performed (left panel). No X-gal (+) cell (asterix) has any BrdU staining. The mean number of BrdU-positive cells (arrows) was determined in 4 comparable sections, viewing 8–16 fields/section under 400× from three mice per each group (right panel). Data are expressed as mean ± SEM. Data are representative of experiments performed on sections from three mice for each group. (C) Histomorphometric analysis for Dmp1-CreERt2:ROSA26R mice receiving intermittent PTH or vehicle treatment for 3 days. Data are expressed as mean ± SEM. a: p < 0.05 versus vehicle treatment. Data are representative of experiments performed on sections from three mice for each group. (D) In situ hybridization analysis of col1 and osteocalcin (oc) mRNA expression in the calvaria from Dmp1-CreERt2:ROSA26R mice receiving intermittent PTH or vehicle treatment for 3 days. Data are representative of experiments performed on sections from three mice for each group.
Figure 5
Figure 5. Electron microscopy analysis of X-gal (+) osteoblastic descendents on the periosteal surface of the calvaria of Dmp1-CreERt2:ROSA26R mice
(A) X-gal stained calvarial bones were sectioned at 1μm thickness to visualize tissue morphology and to align X-gal staining with EM imaging. EM analysis was performed at 22 days after the last 4-OHTam (D43, pre-PTH) or after intermittent PTH (D46) or vehicle-treatments for 3 days (D46). Each lower panel shows a magnified image of the red box in the upper panel. X-gal deposits in the cytoplasm of LacZ+ cells were visible by EM as black amorphous material (arrows). The asterisk indicates collagen fibrils. In Cre negative mice, X-gal deposits were not observed.. Data are representative of experiments performed on sections from four mice for each group. (B) Quantitative analysis of the thickness of X-gal (+) cells on the periosteal surface of the calvaria was performed on electron micrographs. The mean cell thickness was determined in four mice sets with 10–15 micrographs per set. Data are expressed as mean ± SEM, a: p < 0.01 versus pre-PTH or vehicle.

References

    1. Jilka RL. Molecular and cellular mechanisms of the anabolic effect of intermittent PTH. Bone. 2007;40(6):1434–46. - PMC - PubMed
    1. Mendez-Ferrer S, Michurina TV, Ferraro F, Mazloom AR, Macarthur BD, Lira SA, Scadden DT, Ma’ayan A, Enikolopov GN, Frenette PS. Mesenchymal and haematopoietic stem cells form a unique bone marrow niche. Nature. 2010;466(7308):829–34. - PMC - PubMed
    1. Aubin JE, Triffitt JT. Mesenchymal stem cells and osteoblast differentiation. In: Bilezikian JP, Raisz LG, editors. Principles of Bone Biology. Vol. 1. Academic Press; San Diego: 2002. pp. 59–81.
    1. Jilka RL, Weinstein RS, Parfitt AM, Manolagas SC. Quantifying osteoblast and osteocyte apoptosis: challenges and rewards. J Bone Miner Res. 2007;22(10):1492–501. - PubMed
    1. Jilka RL, O’Brien CA, Ali AA, Roberson PK, Weinstein RS, Manolagas SC. Intermittent PTH stimulates periosteal bone formation by actions on post-mitotic preosteoblasts. Bone. 2009;44 (2):275–86. - PMC - PubMed

Publication types