. 2012 May 23;32(21):7191-201.
doi: 10.1523/JNEUROSCI.0071-12.2012.

Fibroblast growth factor 8 organizes the neocortical area map and regulates sensory map topography

Affiliations

Fibroblast growth factor 8 organizes the neocortical area map and regulates sensory map topography

Stavroula Assimacopoulos et al. J Neurosci. .

Abstract

The concept of an "organizer" is basic to embryology. An organizer is a portion of the embryo producing signals that lead to the creation of a patterned mature structure from an embryonic primordium. Fibroblast growth factor 8 (FGF8) is a morphogen that disperses from a rostromedial source in the neocortical primordium (NP), forms a rostral-to-caudal (R/C) gradient, and regulates embryonic and neonatal R/C patterns of gene expression in neocortex. Whether FGF8 also has organizer activity that generates the postnatal neocortical area map is uncertain. To test this possibility, new sources of FGF8 were introduced into the mouse NP with in utero microelectroporation at embryonic day 10.5, close to the estimated peak of area patterning. Results differed depending on the position of ectopic FGF8. Ectopic FGF8 in the caudalmost NP could duplicate somatosensory cortex (S1) and primary visual cortex (V1). FGF8 delivered to the midlateral NP generated a sulcus separating rostral and caudal portions of the NP, in effect creating duplicate NPs. In the caudal NP, ectopic FGF8 induced a second, inclusive area map, containing frontal cortex, S1, V1, and primary auditory areas. Moreover, duplicate S1 showed plasticity to sensory deprivation, and duplicate V1 responded to visual stimuli. Our findings implicate FGF8 as an organizer signal, and its source in the rostromedial telencephalon as an organizer of the neocortical area map.


Figures

Figure 1.
Figure 1.
The mouse area map at P6. A, Schematic of a brain at P6, in dorsolateral view, showing the positions of Fr, S1, V1, and A1. S1 hl, fl, and lj representations are rostral to the whisker barrel fields (barrels in black). Rostral (r), caudal (c), medial (m), and lateral (l) in the map are indicated at lower left; these directions are roughly the same for B–D. B, C, Cux1 and Cdh8 expression is shown by ISH in whole P6 hemispheres. D, SERT-IR is seen in a horizontal section through a flattened P6 cortex. SERT-IR and Cux1 expression delineate subfields of S1 and individual barrels (a–e). V1 is a triangular shape pointing toward rostral rows of the pmbsf. A1 is a roughly oval field, part of which contains strong SERT-IR, caudolateral to S1. Notably, the hl field of S1, the pmbsf, and A1 lie along a line running rostromedial to caudolateral in the hemisphere (D, arrowheads). Cdh8 expression marks the wedge of frontal cortex, which is negative for SERT-IR (C). These area shapes and relationships help identify particular areas in maps with duplications. Scale bar: D (for B–D), 1 mm. fl, forelimb; hl, hindlimb; lj, lower jaw; Li, limbic cortex.
Figure 2.
Figure 2.
Far caudal electroporation of Fgf8 induces duplication of S1. A–D, Sections through flattened P6 cortices stained for SERT-IR or cytochrome oxidase (CO), rostral to the left. E, F, Schematics of electroporation sites superimposed on a standard P6 hemisphere in lateral view, rostral to the left. G, H, High and low magnification of FGF8 IFL in a brain with endogenous and ectopic FGF8 sources. A control brain section (A), and sections from three brains electroporated with Fgf8 at E10.5 (B–D) are shown. Normally, the hl, fl, and lj subfields are rostral to the pmbsf and the snout barrel subfield, and within the pmbsf five barrel rows labeled a–e run caudolateral to rostromedial (A). Native S1 is shown on the left, and duplicate S1 on the right (B–D). B, Duplication of S1. Duplicate S1 (S12) is reversed along the R/C axis relative to S11. The arrowhead indicates row b in S12 (a short, normally caudal row with four barrels) as a landmark. C, Duplication with some native S11 barrels absent. D, Duplication with the pmbsf seen only in S12, and the snout barrel fields of S11 and S12 fused, although hl, fl, and lj subfields are duplicated. E, Electroporation sites that induced duplications in B–D are blue, green, and yellow, respectively; the white outline indicates the approximate position of native and duplicate S1 relative to electroporation sites. F, A plot of 12 of 24 electroporation sites that led to S1 duplications; 10 are caudolateral, and two outliers are caudomedial. The most caudal electroporation sites (blue arrow) produced the most complete duplicate S1s; more rostral sites (green and yellow arrows) generated S1 duplications lacking sections of caudal subfields. G, One sagittal section through an E11 brain electroporated caudally at E10. The endogenous and ectopic, caudal sources of FGF8 generate a double gradient of FGF8 IFL (green). The electroporation site, viewed with tdTomato fluorescence (red), has been superimposed on the image of FGF8 IFL and appears yellow. An arrow indicates roughly where the FGF8 gradient begins to reverse between the two sources. H, Lower magnification of the brain shown in G showing endogenous FGF8 sources in the telencephalon and isthmus (ISO), and ectopic FGF8 in the caudal telencephalon. t, Torso. Scale bars: (in C) A, C, D, 1 mm; B, 0.7 mm; (in G) G, 0.1 mm; H, 0.35 mm.
Figure 3.
Figure 3.
Caudal electroporation of Fgf8 can duplicate V1. A–C, Sections through flattened cortical hemispheres from three brains electroporated with Fgf8 at E10.5 and processed for SERT-IR at P6. In each brain, S12 was accompanied by a duplicate of V1 (V12), identified by a moderately intense SERT-immunoreactive triangular domain oriented so that the triangle appears to point to S12 (Fig. 1). In one brain (C), the two S1s have merged extensively, as have the duplicate V1s. Asterisks indicate folded tissue artifacts. Scale bar: (in A) A, 1 mm; B, 0.8 mm; C, 0.6 mm.
Figure 4.
Figure 4.
Midlateral electroporation of Fgf8 generates an ectopic sulcus. A–F, Whole brains, from a dorsal or lateral (C) aspect. Rostral is up or to the left (C). G–I, Coronal sections through E11.5–E12.5 NP; G and H show the control (G) and Fgf8-electroporated (H) sides of the same brain. A–C, Fgf8/tdTomato coelectroporation sites seen by tdTomato fluorescence (arrows). D–F, Bright-field images of the same brains shown in A–C. The sulcus appears as a slight indentation at E12.5 (D, arrow) and is clear at E15.5 (E) and P6 (F), dividing hemispheres into rostral (r) and caudal (c) pieces. G, H, Apical mitotic cells form a dense line at the ventricular surface on the control side of an E12.5 brain, but are sparse at the site of sulcus formation in the other hemisphere (compare boxed areas). More basally positioned mitotic cells appear at the site of sulcus formation than in control NP (boxed areas, arrowheads in G, H). I, Coronal section through an E11.5 brain. Caspase-3-IR apoptotic cells are most numerous in the choroid plexus epithelium (CPe), and are also scattered near the site of electroporation (e/p). Scale bar: (in A) A, D, 0.6 mm; B, E, 1.0 mm; C, F, 2 mm; G, H, 0.04 mm; I, 0.075 mm.
Figure 5.
Figure 5.
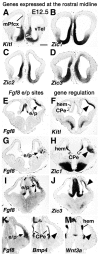
The developing sulcus expresses gene patterns typical of the rostral telencephalic midline. A–M, Coronal sections through E12.5 brains processed with ISH for indicated genes. A–D, Sections from nonelectroporated control brains. E–M, Sections from brains electroporated with Fgf8 at E10.5, processed with ISH to show both normal and ectopic (arrows) Fgf8 expression (E, G, I, K), and neighboring sections from the same brains processed with ISH for the genes named (F, H, J, L, M; arrowheads indicate sites of electroporation. Kitl (formerly Steel, encoding the c-kit ligand) is expressed at the rostral but not caudodorsal telencephalic midline (A, F). Zic genes (Okada et al., 2008) are expressed rostrally (B–D) and caudodorsally (H). Wnt and Bmp genes are expressed caudodorsally in the hem and choroid plexus epithelium (CPe; L, M), but not at the rostral midline (Furuta et al., 1997; Grove et al., 1998). Ectopic FGF8 induces expression of Kitl, Zic1, and Zic3 (F, H, J) and not Bmp4 and Wnt3a (L, M). Inflections in the hemisphere wall (arrowheads) represent the forming sulcus. mPfcx, Medial prefrontal cortex; Se, septum; vTel, ventral telencephalon. Scale bar: (in A) A–D, 0.2 mm; E–M, 0.4 mm.
Figure 6.
Figure 6.
FGF8 at a sulcus generates double gradients of patterning genes and a double rostral identity on either side of the sulcus. A–C, Whole forebrains at E13.5 processed with ISH for the indicated genes. Nr2f1 expression is low rostral to high caudal in control E13.5 hemisphere (A). B shows Nr2f1 expression in a hemisphere with a forming sulcus (asterisk), with a low to high gradient in the rostral part (r1 to m1 to c1) and second low to high gradient in the caudal part (r2 to m2 to c2). Another hemisphere with a forming sulcus (C, asterisk) has double Emx2 expression gradients. D–I, Sagittal sections through control hemispheres (D, G) and hemispheres with sulci (E, F, H, I, asterisks in E, H). Tbr1 is expressed in all layers in frontal cortex (D, arrowhead) and on both sides of a sulcus (E, double arrowheads). A section adjacent to E reveals secondary S1 barrels expressing Rorb (F, arrow) just caudal to the broad expression of Tbr1 in E. These barrels are shown at higher magnification in I. Strong Kitl expression marks layer 6 of far frontal cortex in a control hemisphere (G, arrowhead) and on both sides of an FGF8-induced sulcus (H, double arrowheads). r, Rostral; m, middle; c, caudal. Scale bar: (in I) A–C, 0.3 mm; D–H, 1 mm; I, 0.15 mm.
Figure 7.
Figure 7.
Midlateral FGF8 induces a new area map caudal to the sulcus. A, C–F, Sections through flattened P6 cortices stained for SERT-IR. A section from a control hemisphere (A) and sections from two brains with FGF8-induced sulci are shown (C–F). Sulci reach from lateral to medial in a hemisphere; in sections from flattened cortices, sulci spread wider than appears in whole brains. C, D and E, F are serial sections from the same brains. B, Sample of 10 midlateral electroporation sites that induced sulci; sites for the two brains in C–F are outlined in black. Rostral to the sulcus, parts of both native (C, E, arrows) and inverted, duplicate S1s reflect influence of two FGF8 sources. Caudal to the sulcus (C, E), duplicate maps appear faintly. D, F, In sections adjacent to C and E, clear caudal, duplicate area maps are seen; Fr, S1, V1, and A1 are distinguished by density of SERT-IR, shape, and relative position (compare A, D, F; Fig. 1). r, Rostral; m, middle; c, caudal; l, lateral. Scale bar: (in A) A, C, E, 1 mm; D, F, 0.5 mm.
Figure 8.
Figure 8.
Weak lateral electroporation of Fgf8 leads to two parallel maps. A–C, Adjacent sections in serial order through a single flattened hemisphere processed for SERT-IR. D shows a higher magnification of the box in C. Asterisks (A, C) indicate the position of the electroporation site as identified in whole brain. The hemisphere contains two maps in same R/C orientation. Map 1, most distinct in A, is rostral to the sulcus and contains a complete S1 and V1 (V11). Map 2 in the caudal part of the hemisphere contains a second S1, V12, and A1, clearest in C and D. r, Rostral; m, middle; c, caudal; l, lateral. Scale bar: (in C) A–C, 1 mm; D, 0.4 mm.
Figure 9.
Figure 9.
Duplicated V1 shows visual responses. A, Horizontal white bars, drifting upward across a black background, displayed on monitor centered in front of the mouse; the red X marks the direction of gaze. B, P6 forebrain, dorsal view, processed with ISH for Cdh8 expression. The caudolateral sulcus is marked with an asterisk. In a P6 hemisphere, electroporated at E10.5 (left), Cdh8 expression indicates side-by-side V11 and V12. C, Caudal cortex electroporated at E10.5, imaged at 3 months with intrinsic signal optical imaging. Left, Electroporated hemisphere shows V11 and V12 conformation similar to that of the brain shown in B. Superimposed on the caudal cortex, color-coded summary maps for visual responses to stimuli presented to the contralateral eye are shown. Color-coding represents bar elevations driving the highest activity in a given cortical location. V11 and V12 in the left hemisphere both show visual responses selective for elevation. D, Plot of elevation against distance along axes represented by white lines in C; the bottom of the line is zero. Scale bar: in (C) B, 2 mm; C, 1.0 mm.
Figure 10.
Figure 10.
Duplicate barrels respond to sensory deprivation. A–C, Schematics showing rows of large whiskers (A, B) and corresponding barrels in S1 (C). Both whisker and barrel rows are labeled (a–e). Extra whiskers are red in A, or, like corresponding barrels, marked by Greek lettering (B, C). Blue shapes (C) are barrels representing smaller snout whiskers. D, Section through flattened P6 cortex processed for SERT-IR. Fgf8 was electroporated at E10.5 (caudolateral site). A few hours after birth, the mouse's D2 and D3 whiskers were removed (white circles, bottom left insert) contralateral to electroporation site. D2 and D3 barrels are absent in S11 (left, arrow), and D1 and D4 are slightly enlarged. S12 (right) also shows loss of D2 and D3 (double arrows), and D1 is enlarged. Scale bar, 0.6 mm.
Figure 11.
Figure 11.
Position and strength of ectopic FGF8 shape new area maps. A–D, Top, Schematics of E10.5 control hemisphere (A) and hemispheres electroporated with Fgf8 caudally (B) or midlaterally, either strongly (C) or weakly (D). The endogenous FGF8 source is green; the electroporation site is red. Bottom, Sections through same electroporated brains at P6 (cortices flattened, tangential sections). A, Control cortex with normal R/C polarity (RC). B, Caudal FGF8 generates a new R/C axis opposing normal polarity [R/C then C/R (RCCR)]. Native Fr, S1, and V1 (Fr1, S11, V11) are present, and secondary Fr2, S12, and V12 have been induced. All duplicate areas orient to the new R/C axis, most obviously with S12. C, Strong midlateral source of FGF8 generates a sulcus. A new rostral (Fr2/3 domain) is induced on either side of the sulcus (RCCR/RC). Rostral to sulcus is native Fr1 and S11, and a duplicate, inverted S12. Caudal to sulcus is a map containing Fr3, S13, V12, and A12. D, Weak midlateral source of FGF8 allows native and duplicate maps to develop with the same R/C orientation (RC/RC).

References

    1. Agarwala S, Sanders TA, Ragsdale CW. Sonic hedgehog control of size and shape in midbrain pattern formation. Science. 2001;291:2147–2150. - PubMed
    1. Armentano M, Chou SJ, Tomassy GS, Leingärtner A, O'Leary DD, Studer M. COUP-TFI regulates the balance of cortical patterning between frontal/motor and sensory areas. Nat Neurosci. 2007;10:1277–1286. - PubMed
    1. Aruga J. The role of Zic genes in neural development. Mol Cell Neurosci. 2004;26:205–221. - PubMed
    1. Aruga J, Minowa O, Yaginuma H, Kuno J, Nagai T, Noda T, Mikoshiba K. Mouse Zic1 is involved in cerebellar development. J Neurosci. 1998;18:284–293. - PMC - PubMed
    1. Bishop KM, Goudreau G, O'Leary DD. Regulation of area identity in the mammalian neocortex by Emx2 and Pax6. Science. 2000;288:344–349. - PubMed

Publication types

Substances

LinkOut - more resources