. 2012 May 23;32(21):7373-83.
doi: 10.1523/JNEUROSCI.5110-11.2012.

Running speed alters the frequency of hippocampal gamma oscillations

Affiliations

Running speed alters the frequency of hippocampal gamma oscillations

Omar J Ahmed et al. J Neurosci. .

Abstract

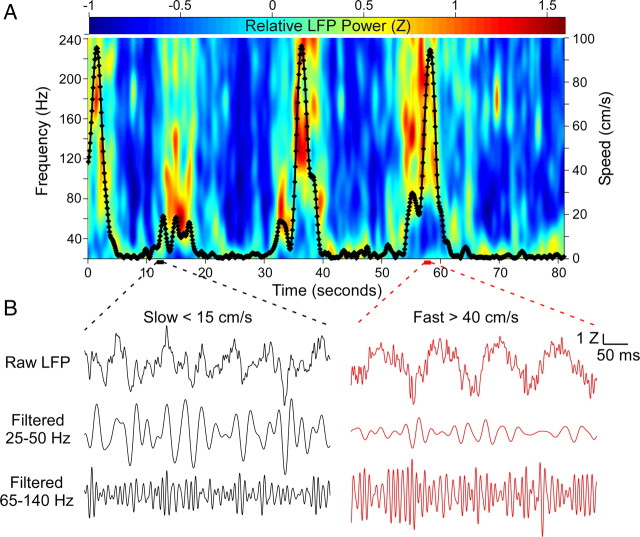
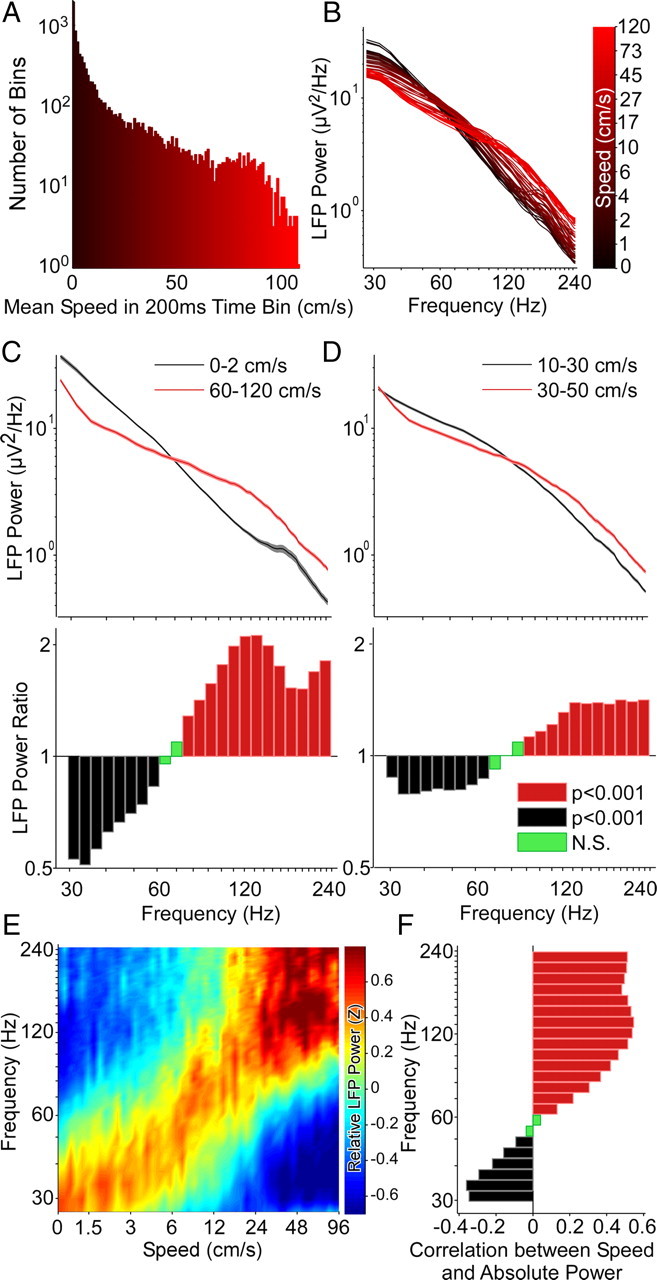
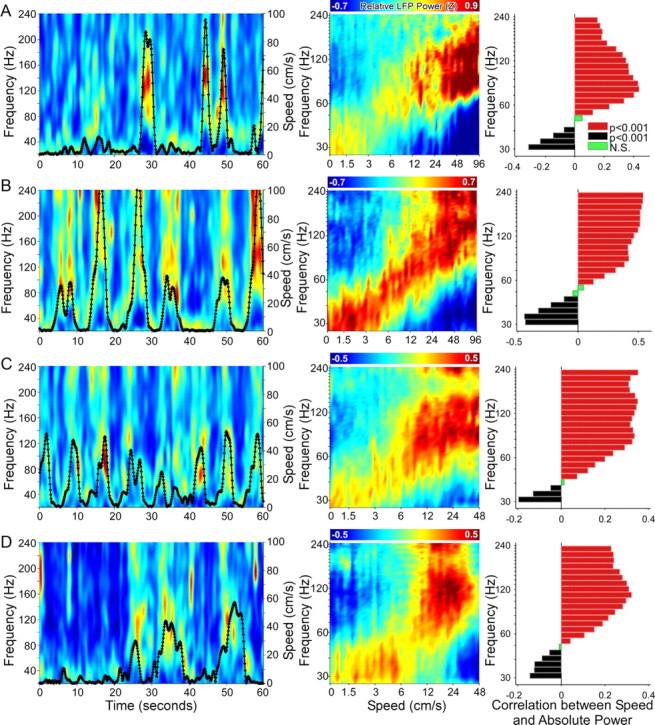
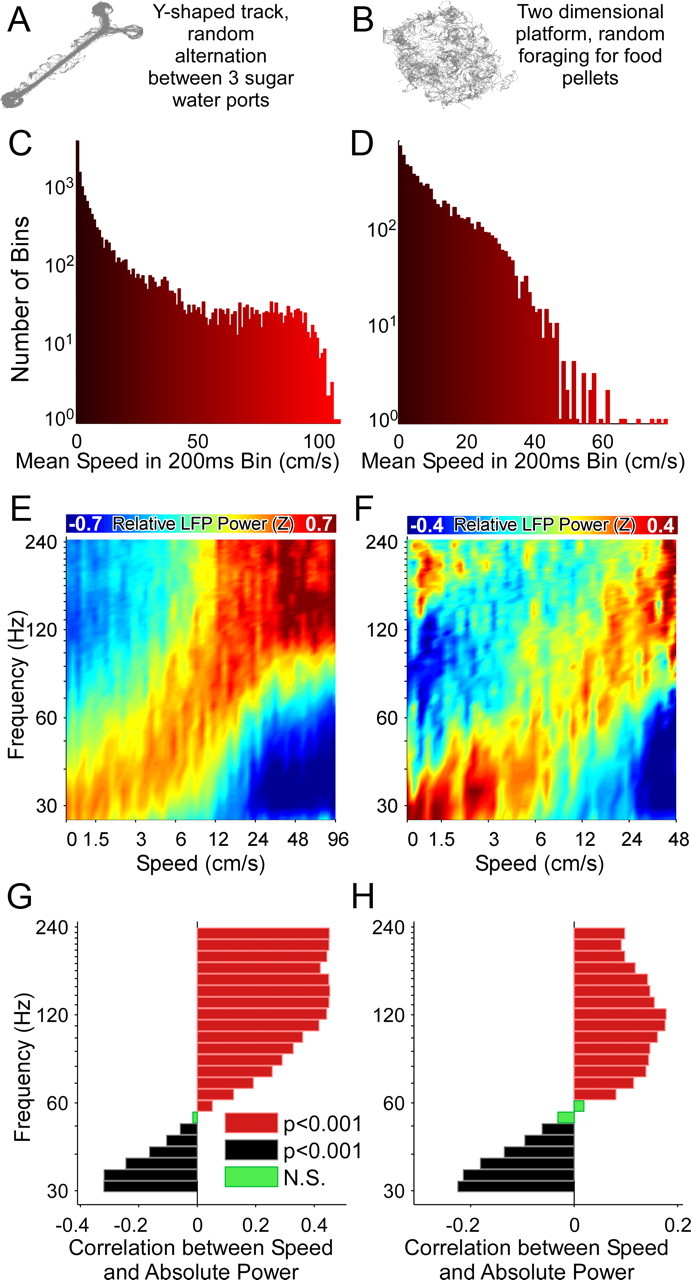
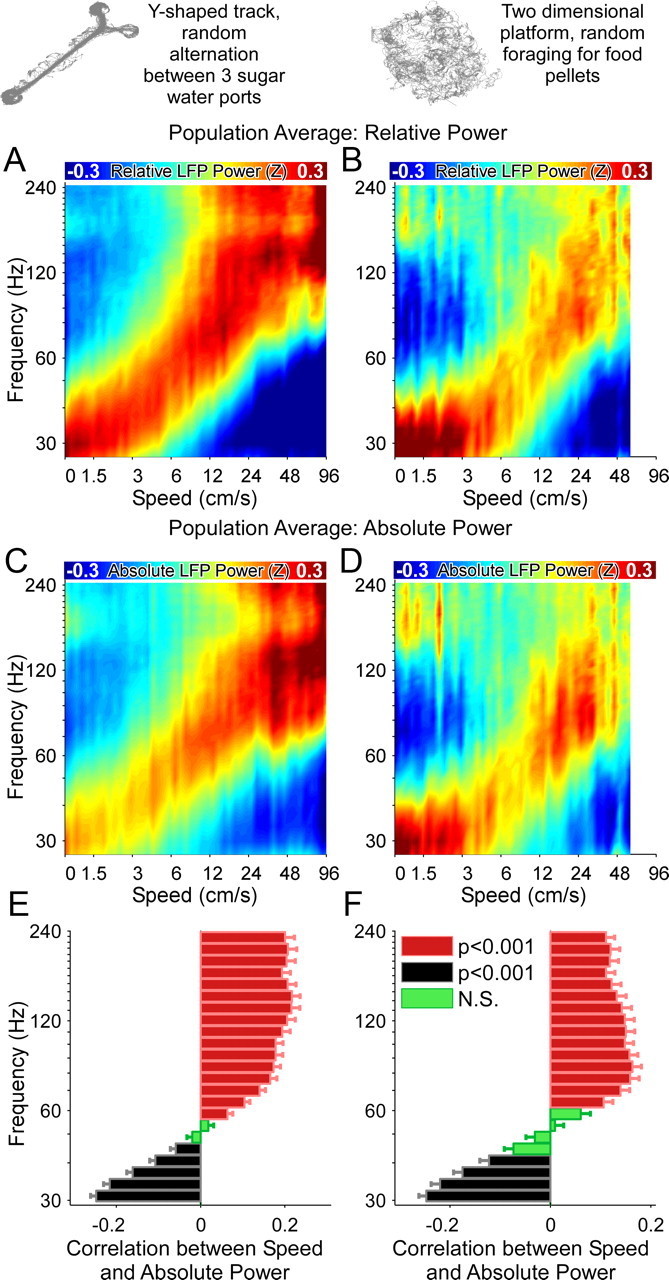
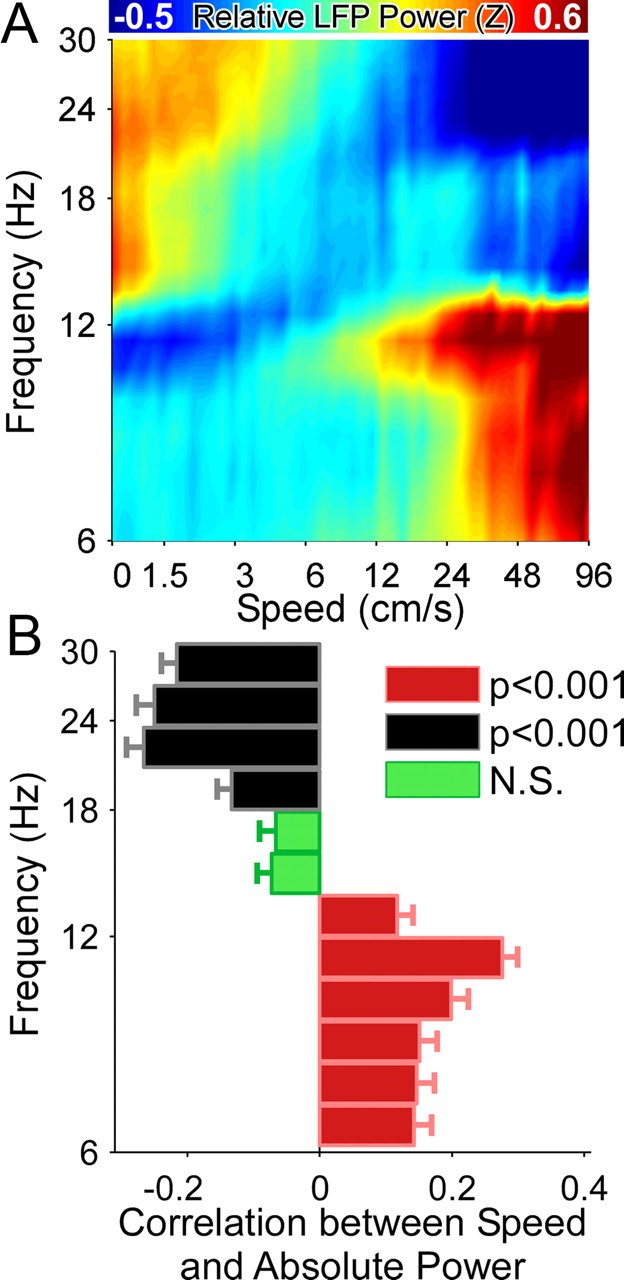
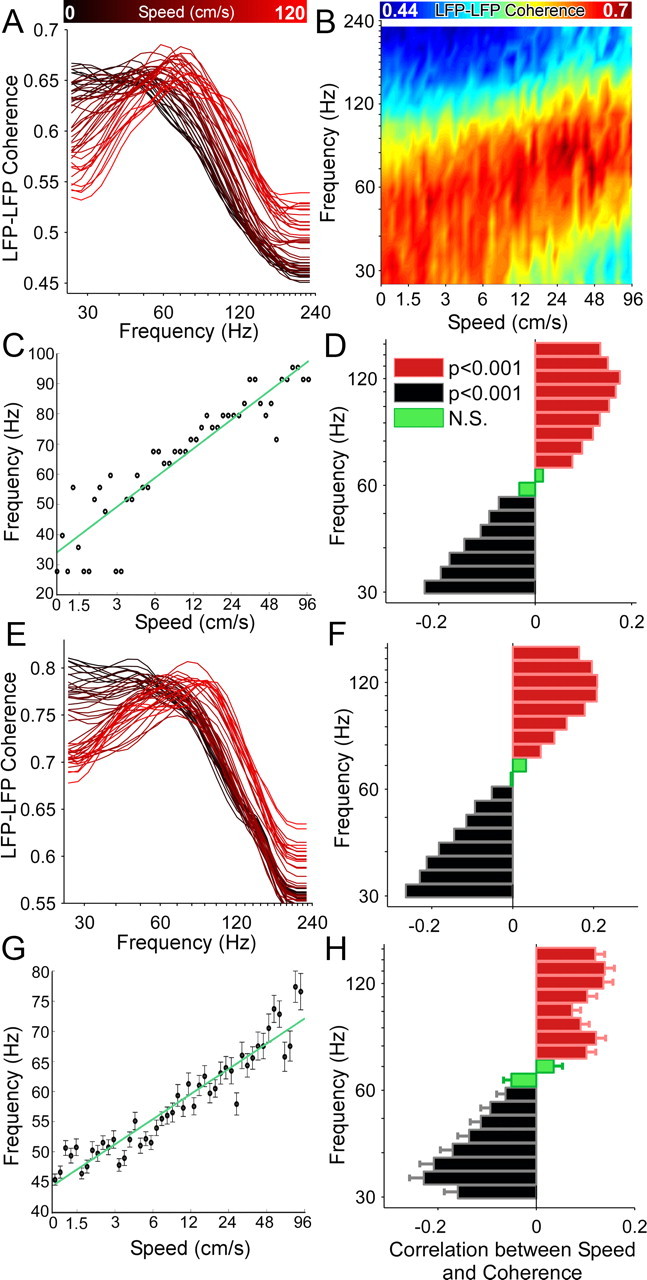
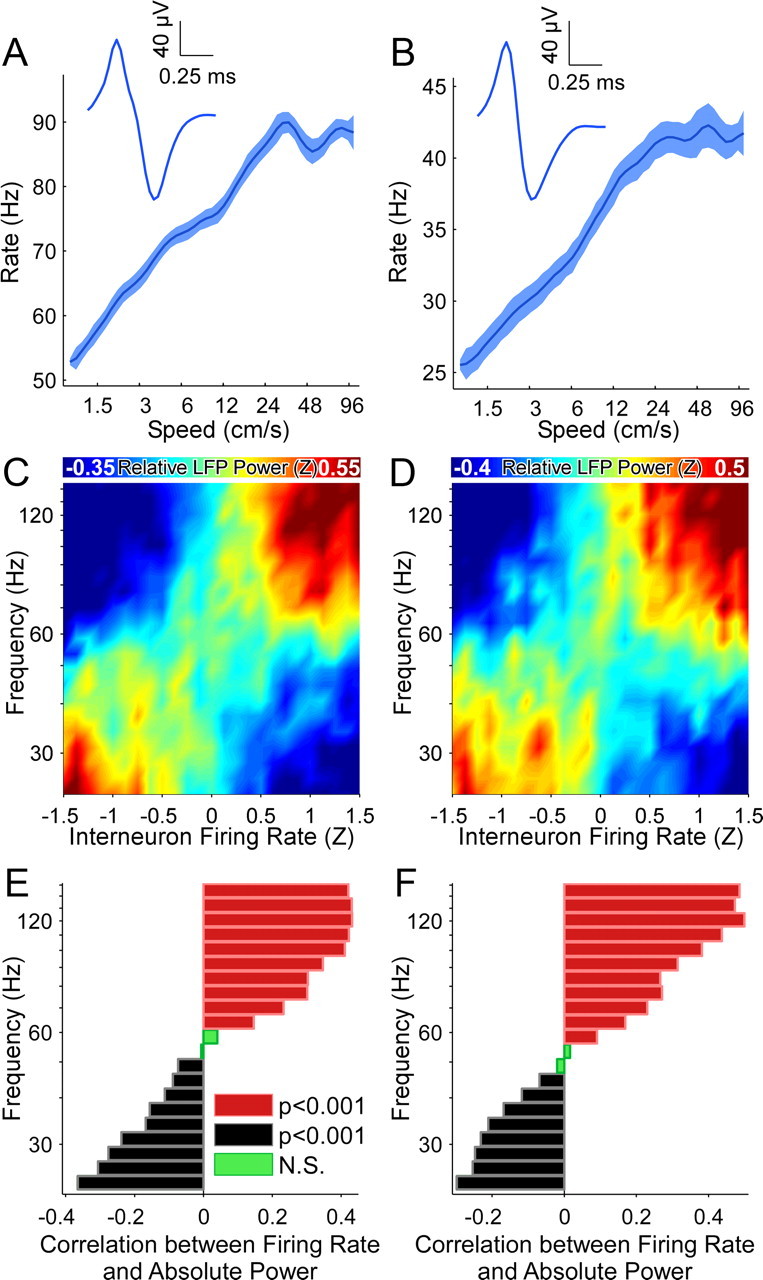
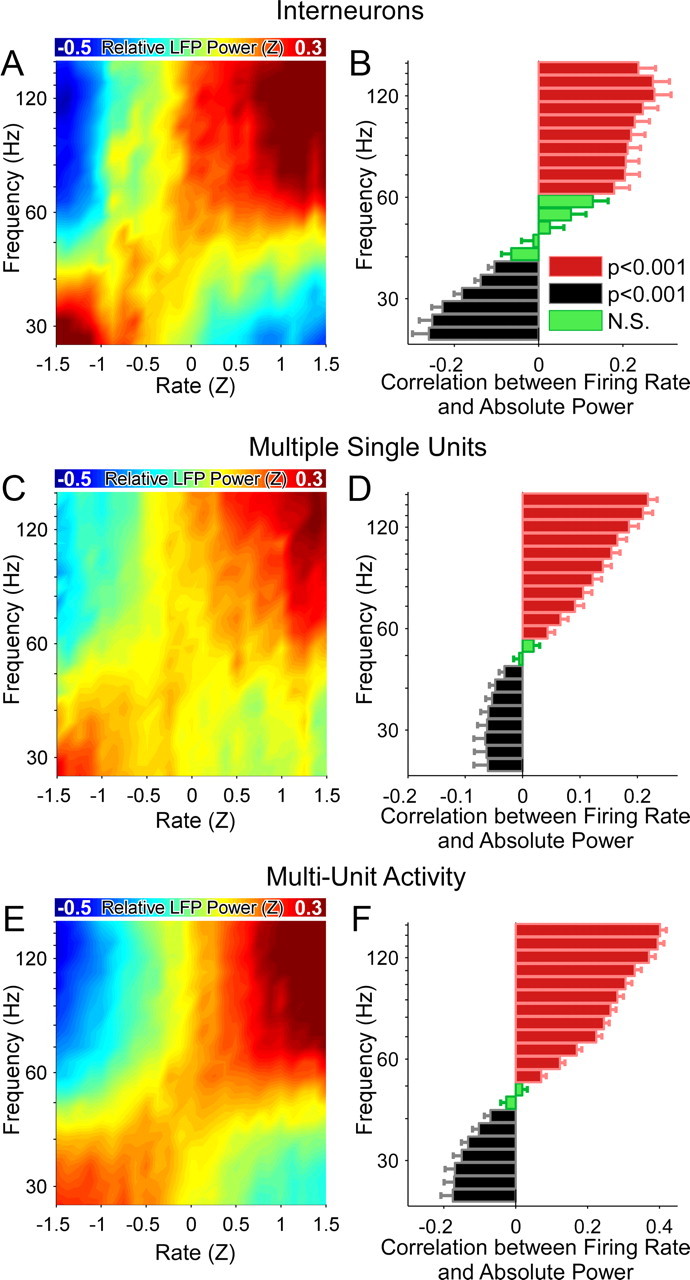
Successful spatial navigation is thought to employ a combination of at least two strategies: the following of landmark cues and path integration. Path integration requires that the brain use the speed and direction of movement in a meaningful way to continuously compute the position of the animal. Indeed, the running speed of rats modulates both the firing rate of neurons and the spectral properties of low frequency, theta oscillations seen in the local field potential (LFP) of the hippocampus, a region important for spatial memory formation. Higher frequency, gamma-band LFP oscillations are usually associated with decision-making, increased attention, and improved reaction times. Here, we show that increased running speed is accompanied by large, systematic increases in the frequency of hippocampal CA1 network oscillations spanning the entire gamma range (30-120 Hz) and beyond. These speed-dependent changes in frequency are seen on both linear tracks and two-dimensional platforms, and are thus independent of the behavioral task. Synchrony between anatomically distant CA1 regions also shifts to higher gamma frequencies as running speed increases. The changes in frequency are strongly correlated with changes in the firing rates of individual interneurons, consistent with models of gamma generation. Our results suggest that as a rat runs faster, there are faster gamma frequency transitions between sequential place cell-assemblies. This may help to preserve the spatial specificity of place cells and spatial memories at vastly different running speeds.


Figures

Figure 1.
Figure 1.
Examples of the frequency changes seen in the hippocampal LFP as a function of running speed. A, Spectrogram showing the changes in frequency as the rat ran freely on a Y-shaped track. The rat's running speed is overlaid in black. Note the increased high-frequency power accompanying increases in the rat's running speed. B, Two 500 ms segments showing the LFP activity at slow (left, black traces) and fast (right, red traces) running speeds. The raw, unfiltered LFP shows slower oscillations at the slow speed, and faster oscillations at fast running speeds. Filtering the data in the low gamma (25–50 Hz) and high gamma (65–140 Hz) range reveal clear differences in the amplitudes of the signals. Low gamma power is higher at slow speeds and high gamma power is higher at fast speeds. Low and high gamma frequency ranges were defined in accordance with the results of Colgin et al. (2009).
Figure 2.
Figure 2.
Running speed alters the frequency of hippocampal LFP. A, The 45 min session on the track was divided into 200 ms segments. This histogram shows the distribution of mean running speeds across all 13384 segments in this session. The power in each frequency band was also calculated in each of these segments and was used to generate B–F. B, Overlaid spectra calculated at 50 different speeds. The color of a spectrum represents the speed at which the spectrum was calculated: black is slow, red is fast. There is a decrease in slope of the spectra as speed increases, suggesting that the frequency content changes with speed. C, Top, Comparison of the averaged spectra during immobility (0–2 cm/s) versus running at fast speeds (> 60 cm/s). Confidence intervals (95%) are plotted around each point, but are too small to be easily visible, indicating extremely low SEs. Bottom, Ratio of power in the fast segments to power in the immobile segments. The black bars represent frequencies that had significantly higher power during immobility (t test; p < 0.001, Bonferroni-adjusted for multiple comparisons), whereas the red bars identify frequencies that had significantly higher power during periods of high speed running. Green bars indicate frequencies that were not significantly different in the two conditions. Low frequencies have more power during immobility than running, whereas high frequencies have more power while running. The two spectra cross at 68 Hz. The dip ∼180 Hz corresponds to the increased power in the 160–200 Hz frequency band during immobility ripples. D, Similar to C, but comparing two closely matched running speeds, 10–30 cm/s versus 30–50 cm/s. Confidence intervals (95%) are included, but are too small to be visible. Note that significant differences in the frequency structure are seen despite the fact that the rat is running in both conditions, suggesting a quantitative influence of running speed on the frequency structure of the local field potential. E, This is confirmed by computing the relative power at each frequency across all speed ranges. The color represents the Z-scored relative power in each frequency band. The power shifts in a graded manner to higher frequencies as a function of increasing speed. F, The absolute power at each frequency band was independently correlated with running speed. Significant negative correlations (black, p < 0.001, Bonferroni-adjusted) were seen for lower frequencies. These correlations became progressively less negative with increasing frequency, transitioning to significant positive correlations >65 Hz. Thus the precise frequency of network gamma oscillations strongly depends on the running speed of the animal, with higher speeds resulting in higher gamma frequencies.
Figure 3.
Figure 3.
Additional examples showing increases in LFP gamma frequency as a function of increasing speed in four rats. A, Left, Spectrogram over a 60 s time period, showing the changes in relative power at each frequency as a rat ran freely on a Y-shaped track for an LFP recorded from the hippocampus. The rat's running speed is overlaid in black. Middle, For the same LFP, the relative power across the session is color coded as a function of both speed and frequency: power shifts to higher frequencies at faster running speeds. Right, For the same LFP, absolute power at lower gamma frequencies is negatively correlated with speed, whereas absolute power at higher gamma frequencies is positively correlated with speed. B, C, D, Data from single LFPs recorded from three other rats show similar increases in gamma frequency as a function of speed.
Figure 4.
Figure 4.
Running speed modulation of LFP frequency is independent of spatial environment. A, C, E, Speed modulation of the oscillation frequency of a single hippocampal LFP on a Y-shaped track. B, D, F, LFP recorded at the same tetrode location as the rat ran on a two-dimensional platform immediately after the track session. Similar modulation of frequency by running speed is seen in both environments. A, B, The spatial occupancy maps in each of the two conditions showing the very different shapes of the two environments. C, D, The distribution of speeds measured >200 ms bins in the two environments. EH, The power shifts in a graded manner to higher frequencies as a function of increasing running speed in both spatial conditions.
Figure 5.
Figure 5.
Population averages show that running speed changes the frequency of CA1 gamma oscillations on both linear and two-dimensional tracks. A, C, E, Population data from 74 LFPs recorded on Y-shaped tracks. B, D, F, Population data from 24 LFPs recorded on two-dimensional platforms. A, B, Color-coded population averages of relative power as a function of speed. C, D, Color-coded population averages of absolute power as a function of speed. Note the very similar relationships obtained using both relative and absolute measures of power. E, F, Low frequencies are negatively correlated, and high frequencies are positively correlated with running speed in each environment. All correlations are performed using absolute power measures. Thus the progressive frequency shift across the gamma-range is independent of the spatial environment.
Figure 6.
Figure 6.
Increased running speed correlates with increased theta power. A, Population data from 74 LFPs recorded on Y-shaped tracks showing the effect of running speed on LFP frequencies between 6 and 30 Hz. Theta power (6–12 Hz) increases at faster running speeds, whereas power at 13–30 Hz decreases. B, Theta frequencies (6–12 Hz) are significantly positively correlated with running speed, whereas frequencies between 18 and 30 Hz are significantly negatively correlated with speed.
Figure 7.
Figure 7.
Increased running speed is accompanied by LFP–LFP coherence at higher gamma frequencies. A, Coherence between two hippocampal electrodes provides a measure of the synchrony across the long axis of the hippocampus. Here the coherence between two electrodes in CA1, positioned 0.7 mm apart, is shown at different speeds. Black indicates slow speeds, red indicates faster speeds. The coherence curves shift to higher gamma frequencies as a function of speed. B, The same data as in A, with color-coded coherence. The shift to higher frequencies in the gamma range (30–120 Hz) as a function of increasing speed is clearly visible. C, The running speed of the rat is plotted against the maximally coherent frequency at each speed. These data are from the same LFPs shown in A and B. The most-coherent frequency robustly increases as a function of running speed (r = 0.95, p < 0.001), showing that the frequency of network oscillations shifts to higher frequencies synchronously across the hippocampus at faster speeds. D, The LFP–LFP coherence (same data as A–C) at each frequency band was independently correlated with running speed. Significant negative correlations (black, p < 0.001, Bonferroni-adjusted) were seen for lower frequencies. These correlations became progressively less negative with increasing frequency, transitioning to significant positive correlations ∼70 Hz (red, p < 0.001). Thus coherence and power show very similar relationships to running speed. E, Another example from the same session showing an electrode pair separated by 0.3 mm. Note the higher coherences in this case, but identical shifts to higher frequencies at higher speeds. Color coded as described in A. F, Correlations for the pair shown in E. Color coded as described in D. G, Same as C, but for the entire population data. H, Same as D and F, but for the entire population data.
Figure 8.
Figure 8.
Firing rates of individual interneurons correlate with the gamma frequency of hippocampal LFP. Data from two interneurons, recorded simultaneously on the same tetrode as the rat ran on a y-shaped track. A, C, E, Interneuron 1, which had a mean firing rate of 33 Hz. B, D, F, Interneuron 2, which had a mean firing rate of 69 Hz. A, B, Both interneurons increase their firing rate as a function of increasing speed. Insets, The narrow extracellular spike shapes are indicative of putative fast-spiking interneurons. C, D, As the normalized (Z-scored) rate of each interneuron increases, there is a shift to higher LFP frequencies. The interneuron and LFP were recorded simultaneously on different hippocampal electrodes. Note that this shift is independent of the absolute firing rates of the two interneurons, and instead depends on the firing rate of each interneuron relative to its mean rate. E, F, Lower LFP frequencies are negatively correlated with each interneuron's Z-scored firing rate, whereas higher frequencies are positively correlated. Thus the normalized rate of interneuron firing is predictive of the shift in LFP frequencies across the gamma-band.
Figure 9.
Figure 9.
Firing rates of individual interneurons and multiunit activity correlate with the frequency of hippocampal LFP—population averages. A, As the mean Z-scored firing rate of the population of interneurons increases, the frequency of CA1 gamma oscillations also increases. B, Lower gamma frequencies are more likely at lower interneuron firing rates, whereas higher gamma frequencies are more likely at higher interneuron firing rates. C, D, Similar to A and B, but for multiple single unit activity of pyramidal cells. E, F, Similar to A and B, but for all multiunit activity.

References

    1. Ahmed OJ. Brown University; 2010. Interpreting the rhythms of the hippocampus and neocortex. PhD thesis.
    1. Ahmed OJ, Mehta MR. The hippocampal rate code: anatomy, physiology and theory. Trends Neurosci. 2009;32:329–338. - PMC - PubMed
    1. Angelaki DE, Cullen KE. Vestibular system: the many facets of a multimodal sense. Annu Rev Neurosci. 2008;31:125–150. - PubMed
    1. Barlow JS. Inertial navigation as a basis for animal navigation. J Theor Biol. 1964;6:76–117. - PubMed
    1. Best PJ, White AM, Minai A. Spatial processing in the brain: the activity of hippocampal place cells. Annu Rev Neurosci. 2001;24:459–486. - PubMed

Publication types