

Locally advanced breast cancer: MR imaging for prediction of response to neoadjuvant chemotherapy--results from ACRIN 6657/I-SPY TRIAL
- PMID: 22623692
- PMCID: PMC3359517
- DOI: 10.1148/radiol.12110748
Locally advanced breast cancer: MR imaging for prediction of response to neoadjuvant chemotherapy--results from ACRIN 6657/I-SPY TRIAL
Abstract
Purpose: To compare magnetic resonance (MR) imaging findings and clinical assessment for prediction of pathologic response to neoadjuvant chemotherapy (NACT) in patients with stage II or III breast cancer.
Materials and methods: The HIPAA-compliant protocol and the informed consent process were approved by the American College of Radiology Institutional Review Board and local-site institutional review boards. Women with invasive breast cancer of 3 cm or greater undergoing NACT with an anthracycline-based regimen, with or without a taxane, were enrolled between May 2002 and March 2006. MR imaging was performed before NACT (first examination), after one cycle of anthracyline-based treatment (second examination), between the anthracycline-based regimen and taxane (third examination), and after all chemotherapy and prior to surgery (fourth examination). MR imaging assessment included measurements of tumor longest diameter and volume and peak signal enhancement ratio. Clinical size was also recorded at each time point. Change in clinical and MR imaging predictor variables were compared for the ability to predict pathologic complete response (pCR) and residual cancer burden (RCB). Univariate and multivariate random-effects logistic regression models were used to characterize the ability of tumor response measurements to predict pathologic outcome, with area under the receiver operating characteristic curve (AUC) used as a summary statistic.
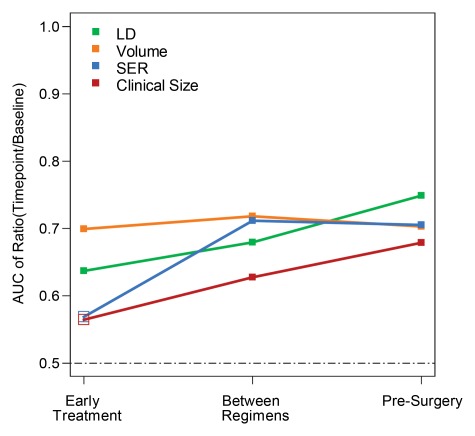
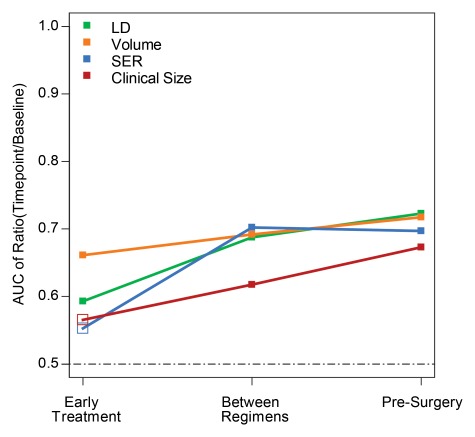
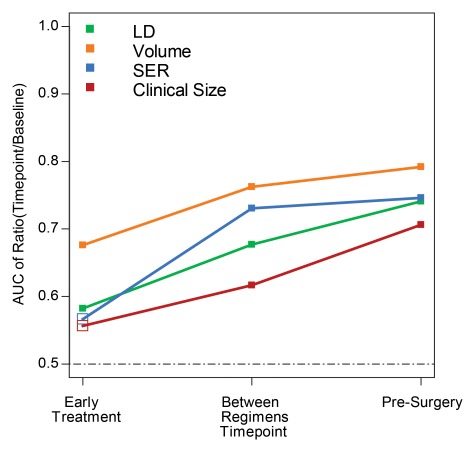
Results: Data in 216 women (age range, 26-68 years) with two or more imaging time points were analyzed. For prediction of both pCR and RCB, MR imaging size measurements were superior to clinical examination at all time points, with tumor volume change showing the greatest relative benefit at the second MR imaging examination. AUC differences between MR imaging volume and clinical size predictors at the early, mid-, and posttreatment time points, respectively, were 0.14, 0.09, and 0.02 for prediction of pCR and 0.09, 0.07, and 0.05 for prediction of RCB. In multivariate analysis, the AUC for predicting pCR at the second imaging examination increased from 0.70 for volume alone to 0.73 when all four predictor variables were used. Additional predictive value was gained with adjustments for age and race.
Conclusion: MR imaging findings are a stronger predictor of pathologic response to NACT than clinical assessment, with the greatest advantage observed with the use of volumetric measurement of tumor response early in treatment.
Figures
Comment in
-
MR imaging for the prediction of breast cancer response to neoadjuvant chemotherapy.Radiology. 2013 Jan;266(1):367. doi: 10.1148/radiol.12124051. Radiology. 2013. PMID: 23264533 No abstract available.
-
MR imaging for the prediction of breast cancer response to neoadjuvant chemotherapy.Radiology. 2013 Jan;266(1):367. doi: 10.1148/radiol.12124051. Radiology. 2013. PMID: 23390630 No abstract available.
References
-
- Fisher B, Bryant J, Wolmark N, et al. Effect of preoperative chemotherapy on the outcome of women with operable breast cancer. J Clin Oncol 1998;16(8):2672–2685 - PubMed
-
- Wolmark N, Wang J, Mamounas E, Bryant J, Fisher B. Preoperative chemotherapy in patients with operable breast cancer: nine-year results from National Surgical Adjuvant Breast and Bowel Project B-18. J Natl Cancer Inst Monogr 2001;(30):96–102 - PubMed
-
- Esserman L, Hylton N, Yassa L, Barclay J, Frankel S, Sickles E. Utility of magnetic resonance imaging in the management of breast cancer: evidence for improved preoperative staging. J Clin Oncol 1999;17(1):110–119 - PubMed
-
- Weatherall PT, Evans GF, Metzger GJ, Saborrian MH, Leitch AM. MRI vs. histologic measurement of breast cancer following chemotherapy: comparison with x-ray mammography and palpation. J Magn Reson Imaging 2001;13(6):868–875 - PubMed
-
- Schnall MD, Blume J, Bluemke DA, et al. MRI detection of distinct incidental cancer in women with primary breast cancer studied in IBMC 6883. J Surg Oncol 2005;92(1):32–38 - PubMed
Publication types
MeSH terms
Grants and funding
LinkOut - more resources
Full Text Sources
Other Literature Sources
Medical
