. 2012 May 23;4(135):135ra67.
doi: 10.1126/scitranslmed.3003815.

Modeling the dynamic relationship between HIV and the risk of drug-resistant tuberculosis

Affiliations

Modeling the dynamic relationship between HIV and the risk of drug-resistant tuberculosis

Rinat Sergeev et al. Sci Transl Med. .

Abstract

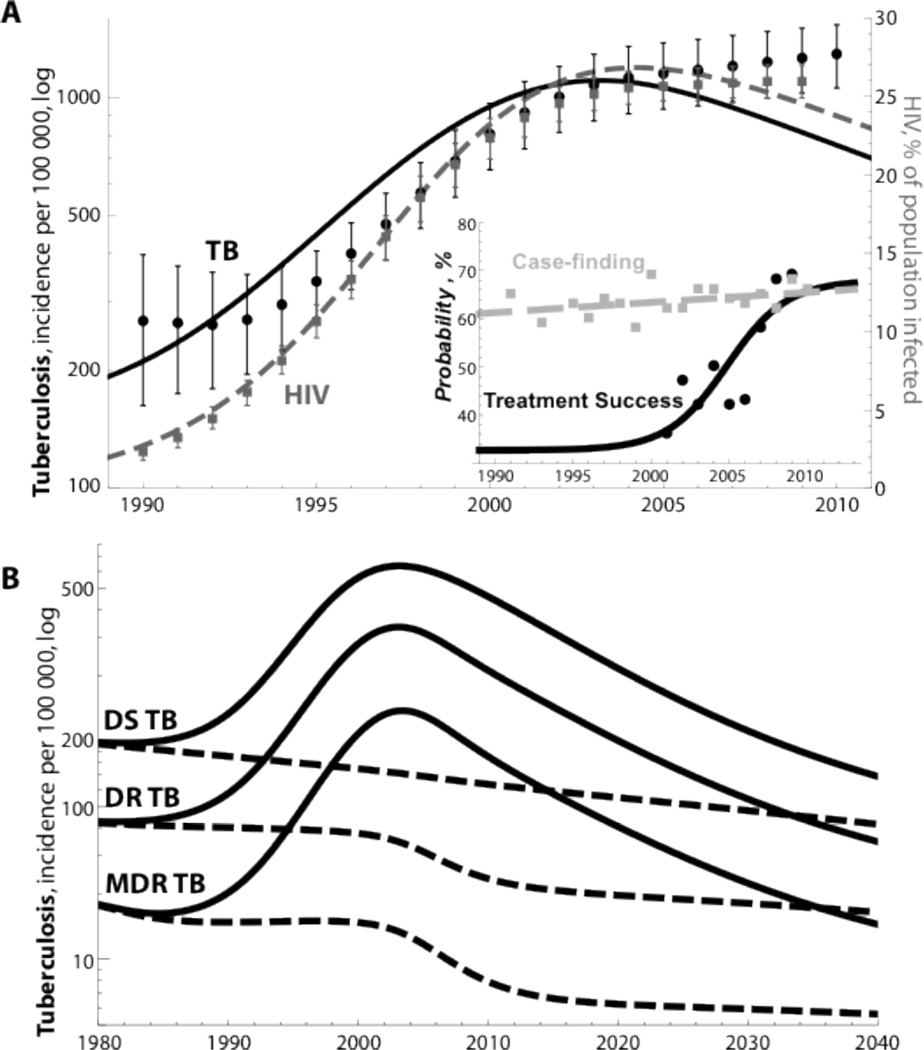
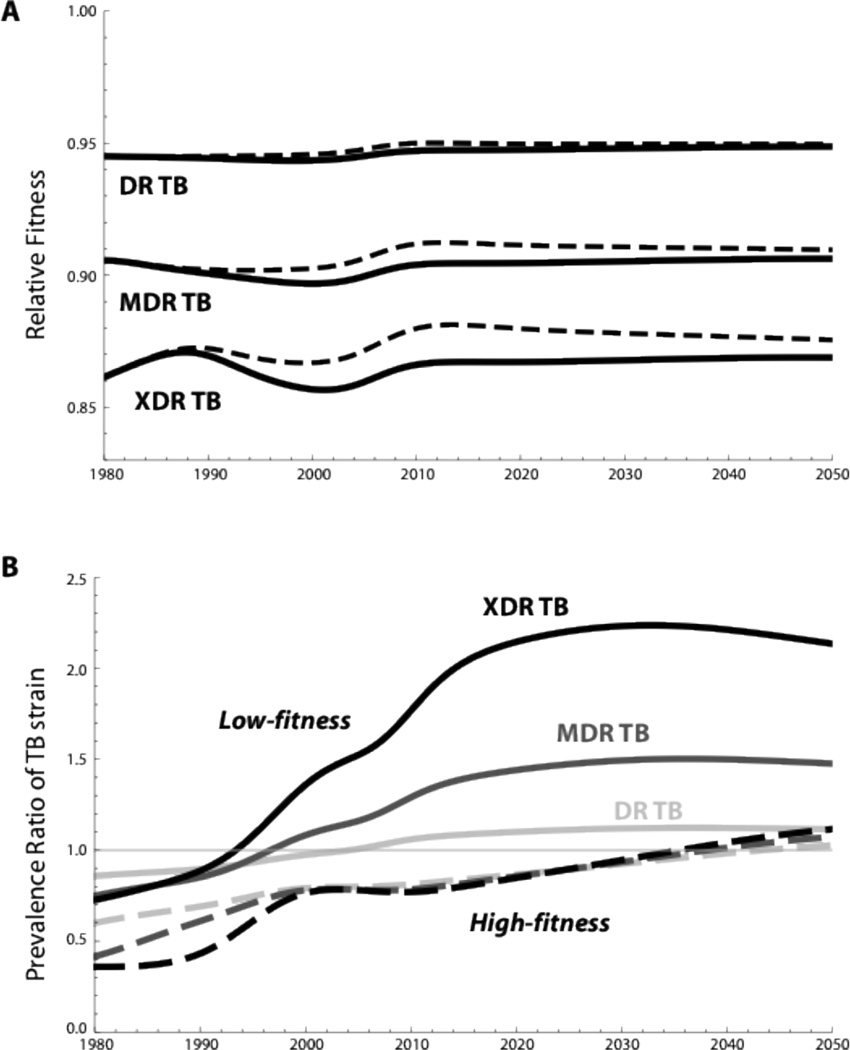
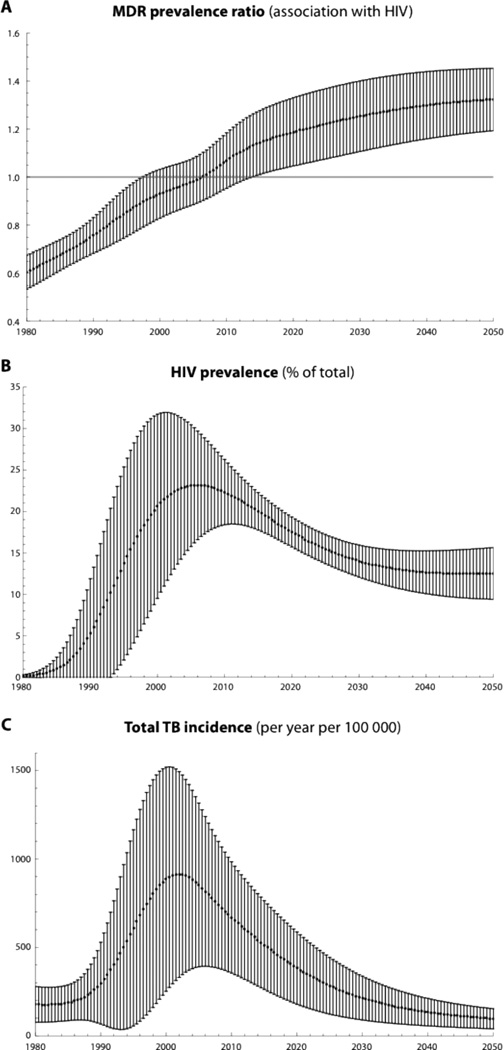
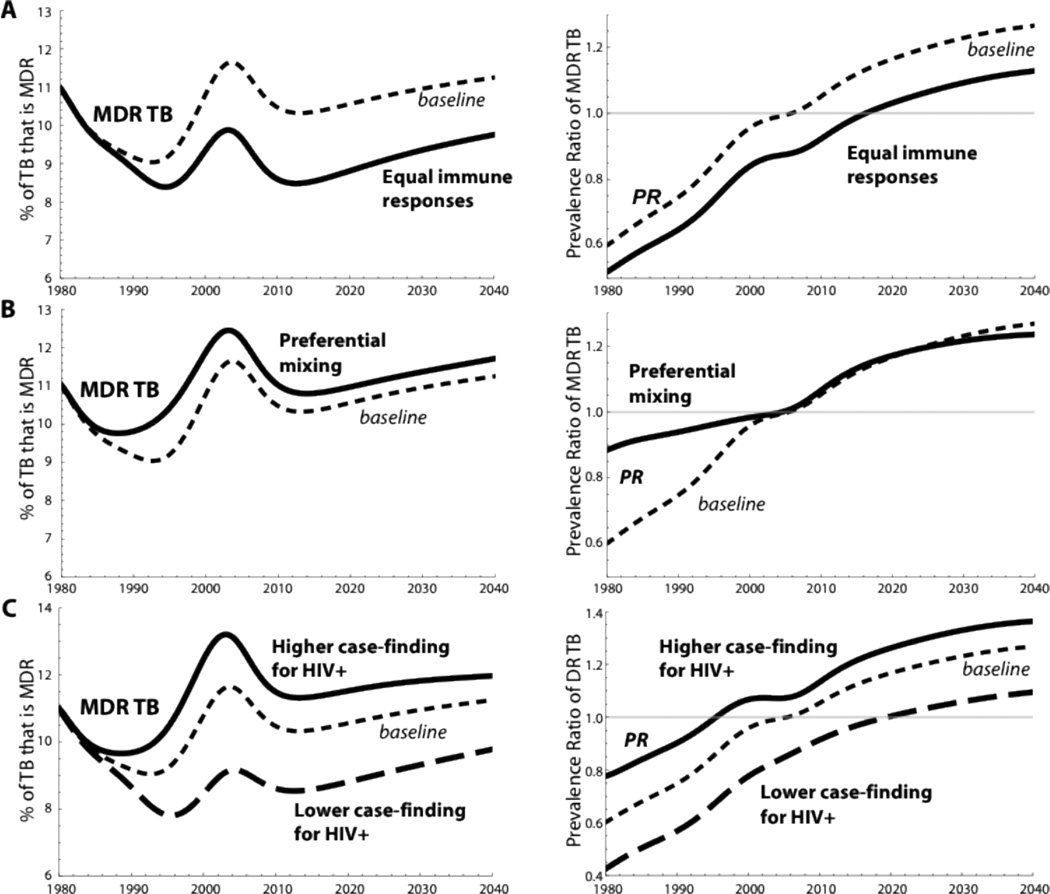
The emergence of highly drug-resistant tuberculosis (TB) and interactions between TB and HIV epidemics pose serious challenges for TB control. Previous researchers have presented several hypotheses for why HIV-coinfected TB patients may suffer an increased risk of drug-resistant TB (DRTB) compared to other TB patients. Although some studies have found a positive association between an individual's HIV status and his or her subsequent risk of multidrug-resistant TB (MDRTB), the observed individual-level relationship between HIV and DRTB varies substantially among settings. Here, we develop a modeling framework to explore the effect of HIV on the dynamics of DRTB. The model captures the acquisition of resistance to important classes of TB drugs, imposes fitness costs associated with resistance-conferring mutations, and allows for subsequent restoration of fitness because of compensatory mutations. Despite uncertainty in several key parameters, we demonstrate epidemic behavior that is robust over a range of assumptions. Whereas HIV facilitates the emergence of MDRTB within a community over several decades, HIV-seropositive individuals presenting with TB may, counterintuitively, be at lower risk of drug-resistant TB at early stages of the co-epidemic. This situation arises because many individuals with incident HIV infection will already harbor latent Mycobacterium tuberculosis infection acquired at an earlier time when drug resistance was less prevalent. We find that the rise of HIV can increase the prevalence of MDRTB within populations even as it lowers the average fitness of circulating MDRTB strains compared to similar populations unaffected by HIV. Preferential social mixing among individuals with similar HIV status and lower average CD4 counts among HIV-seropositive individuals further increase the expected burden of MDRTB. This model suggests that the individual-level association between HIV and drug-resistant forms of TB is dynamic, and therefore, cross-sectional studies that do not report a positive individual-level association will not provide assurance that HIV does not exacerbate the burden of resistant TB in the community.


Figures

Figure 1
Figure 1. Reported individual-level associations between HIV and MDRTB
a) Forest plot depicting the association between cases of HIV infection and MDRTB and corresponding 95% confidence intervals in countries reporting at least one MDRTB case among patients with HIV-positive and HIV-negative status in population-representative TB drug resistance surveys/surveillance. The plot is adopted from WHO 2010 report [5] with permission from WHO. b) Figure adapted from Suchindran et al. 2011 [19]. Forest plot of MDRTB prevalence ratios by HIV status and corresponding 95% confidence intervals from studies in Sub-Saharan Africa regions (see references therein for studies included). The result of the latest study Sanchez-Padilla et al. 2012 [20] is added.
Figure 2
Figure 2. Simplified model structure
a) Schematic overview of the mathematical model of TB/HIV dynamics. The natural history of tuberculosis is represented by compartments for Susceptibles (S), Latently infected (L), and Infectious individuals (I). HIV-seropositiveindividuals are designated by the + superscript. Details of flow between compartments and model equations are provided in the Supplementary Materials. b) Fitness mapping of mycobacterial strains modeled by number of drug resistances (n=0 for DS strain; 1 for single DR; 2 for MDR; 3 for XDR; etc) and by the number of compensatory events (0≤kn, one compensatory mutation per each resistance). The pair of numbers (n,k) defines each type of mycobacteria modeled. The Y-axis shows the relative fitness of each strains compared to wild type on the log-scale (according to equation 4). Assumed fitness thresholds for HIV− and HIV+ individuals are shown by the thin dashed black lines for a reference.
Figure 3
Figure 3. Simulated epidemics
a) The total TB incidence and HIV prevalence (black solid and grey dashed lines) in comparison with the data for adults (age 15+) from Swaziland [22] (black dots and gray squares with corresponding 95% confidence intervals respectively). The inset shows the data and approximations used for case-finding (gray) and treatment success (black). b) Modeled trends of the incidence of drug sensitive, drug resistant, and multi-drug resistant (MDR) in populations with epidemic HIV (solid lines) and without HIV (thick dashed lines).
Figure 4
Figure 4. Trends in the individual-level association between HIV and DRTB
The projected trends in the percentage of TB incidence (left panels) that is with: a) DR strains; and b) MDR strains. For panels a–b, trends for HIV+ and HIV− individuals within populations with epidemic HIV are represented by dashed lines and solid lines, respectively. The trend for individuals in populations unaffected by HIV is shown with a thin dashed line. The right panels show the prevalence ratios of drug-resistance between HIV-seropositive and HIV-seronegative hosts (PR) in the population with epidemic HIV. A value PR=1, representing the absence of association between drug resistance of M. Tb and HIV, is shown as thin gray line. c) The fraction of total MDRTB that is due to transmission (left panel). The right panel shows the prevalence ratio (PR) for transmitted (solid line) and acquired (dashed line) MDRTB.
Figure 5
Figure 5. Trends in the average relative fitness of DRTB and its impact on prevalence ratio
a) Relative fitness values are compared with the referent drug sensitive TB. The solid lines represent the fitness trends in populations with both TB and HIV. The dashed lines show the fitness trajectories in an HIV-free population. The maximum possible values for the fitness of each type of resistance (i.e. where all resistance mutations are accompanied by compensatory mutations, k=n) are: 0.99 for DR TB; 0.98 for MDR TB; and 0.97 for XDR TB. Trends in fitness for the resistant strains do not approach these maximal levels over the next several decades in our simulations. b) Prevalence ratio (PR) of drug-resistance between HIV-seropositive and HIV-seronegative hosts for low-fit (k=0, solid lines) and high-fit (k=n, dashed lines) drug-resistant strains. Strains with different number of resistances are represented by shading: DR (n=1) – light gray; MDR (n=2) – gray; and XDR (n=3) – black.
Figure 6
Figure 6. Multivariable sensitivity analysis
Distribution of 3000 simulation runs with model parameter sets sampled over the ranges listed in Table S1. The mean value is shown by the dotted line; the bars indicate one standard deviation above and below this mean value. The three panels show: a) the individual-level association (PR) between MDRTB and HIV; b) The prevalence of HIV (%); c) The incidence of all forms of TB (per 100 000).
Figure 7
Figure 7. Effects of altering of key model parameters
The left panels indicate the trend in the proportion of TB that is MDR and right panels indicate the trend in the individual-level relative risk of MDR among HIV-seropositive and HIV-seronegative hosts with TB. The solid lines represent an increase in the value of each parameter over baseline, dashed lines represent a decrease in the value, and the thin dashed lines represent a baseline value. Shown on the panels are: a) Variation of the fitness threshold for HIV-seropositives compared to hosts without HIV. Solid line: fitness thresholds are equal; thin dashed line: fitness threshold for HIV-seropositives is 0.75 of that for HIV-seronegatives. b) Variation of mixing patterns. Solid line: assortative mixing such that individuals with the same HIV status are twice as likely to contact each other; thin dashed line: homogeneous mixing (see Supplement for additional details). c) Variation of the relative rate of case detection. The probability of case detection before self-cure or death is set to be 50% higher (solid), equal (thin dashed), and 50% lower (dashed) for a HIV-coinfected TB patient than a TB patient without HIV.

Comment in

References

    1. Global tuberculosis control 2011. Geneva, Switzerland: WHO report, World Health Organization; 2011.
    1. Lawn SD, Churchyard G. Epidemiology of HIV-associated tuberculosis. Current Opinion in HIV and AIDS. 2009;4:325–333. - PMC - PubMed
    1. Getahun H, Gunneberg C, Granich R, Nunn P. HIV Infection-Associated Tuberculosis: The Epidemiology and the Response. Clinical Infectious Diseases. 2010;50:S201–S207. - PubMed
    1. Wells CD, Cegielski JP, Nelson LJ, Laserson KF, Holtz TH, Finlay A, Castro KG, Weyer K. HIV Infection and Multidrug-Resistant Tuberculosis – The Perfect Storm. The Journal of Infectious Diseases. 2007;196:S86–S107. - PubMed
    1. Multidrug and extensively drug-resistant TB (M/XDR-TB) Geneva, Switzerland: WHO global report on surveillance and response, World Health Organization; 2010. [Figure 4 from page 14 of the report is adopted as Figure 1a with permission from WHO]

Publication types

MeSH terms

Substances