

doi: 10.4103/0971-3026.95402.
Myositis ossificans imaging: keys to successful diagnosis
Affiliations
- PMID: 22623814
- PMCID: PMC3354355
- DOI: 10.4103/0971-3026.95402
Item in Clipboard
Myositis ossificans imaging: keys to successful diagnosis
Indian J Radiol Imaging.
2012 Jan.
Abstract
Myositis ossificans (MO) is an inflammatory pseudotumor of the muscle that may be mistaken clinically and even histologically for a malignant soft tissue tumor. The aim of this article is to report the imaging characteristics of MO, the emphasis being on the early diagnostic clues. USG can be used at an early stage to reveal the 'zone phenomenon,' which is highly suggestive of MO. A short course of nonsteroidal anti-inflammatory drug therapy may be an efficient treatment for early MO.
Keywords: Myositis ossificans; ossification; tumor; ultrasonography; zone phenomenon.
Conflict of interest statement
Figures

Diagram showing the different stages of MO. USG is the most sensitive technique for early demonstration of the zone phenomenon. If biopsy is done it must not be performed during the early phases of MO, as there are high false positive rates for the misdiagnosis of sarcomatous tumor.
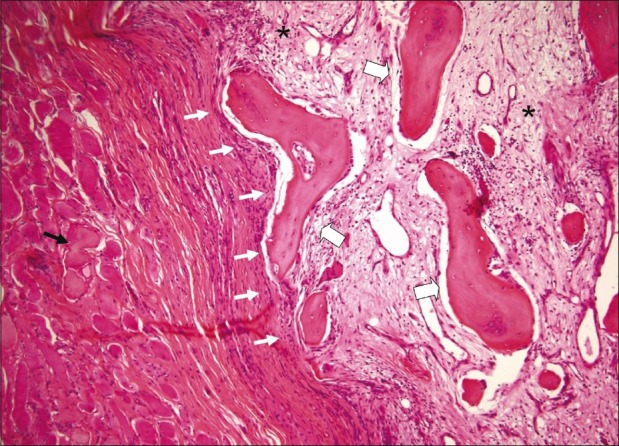
Histological section of a mature lesion of MO (H and E, ×100). The section shows a central myxoid matrix with fibroblasts (pseudo-fibrosarcomatous zone) (stars) surrounded by mature bone at the periphery of the lesion (large arrows). The lesion is well-circumscribed (white arrows). Muscle fibers are displayed around the lesion (black arrow)

Histological section of extraskeletal osteosarcoma (H and E, ×100). The section shows an ill-defined lesion composed of a linear bony framework (large arrows) irregularly interspersed between tumor cells (stars). Adipocytes can also be observed (cross)

Painful left anterolateral thigh mass in a 9-year-old boy. There was no history of trauma. Initial standard radiographs were normal. Anteroposterior radiograph (A) of the femur at day 8 shows unilamellar periosteal reaction (arrow). USG at day 15 (B) shows an intramuscular mass with a hypoechoic center (star) and hyperechoic periphery (arrow). Anteroposterior radiographs at day 15 (C) and day 23 (D) show de novo ossifications arranged along the muscle fiber axis (large arrows) and located around a central noncalcified area. At day 23, coronal T1W (E) and T2W (F) MRI images show the lesion with a hypointense rim (arrows). The T2W MRI also shows a central hyperintensity area and soft tissue edema surrounding the lesion (star). Axial contrast-enhanced T1W MRI (G) shows rim enhancement (arrowhead), indicating a zone phenomenon

De novo inflammatory mass on the posterior aspect of the left arm in a 57-year-old man. There was no history of trauma. Axial CT scan at day 16 (A), shows the presence of a slightly hypointense lesion with peripheral ossifications (arrow). USG at day 16 (B), shows a central hypoechoic area (star) encircled by a peripheral hyperechoic area, which corresponds to the calcified area (arrowheads). The third zone is the most peripheral area and is hypoechoic (large arrow). Surrounding hyperemia can be seen on Doppler (black arrows). Axial contrast enhanced fat-suppressed T1W MRI (C) shows global homogeneous enhancement of the lesion (arrow). Two months later, axial contrast enhanced fat-suppressed T1W MRI (D) shows dramatic reduction in the size and intensity of contrast enhancement (arrow). CT scan (E) demonstrates the disappearance of most of the ossifications (arrow)

Rapidly-growing painful mass in the left arm in a 15-year-old girl. There was no history of trauma. Axial T1W MRI (A) shows moderate hyperintensity of the lesion (black arrows). Axial contrast enhanced fat-suppressed T1W MRI (B) shows rim enhancement of the lesion (large arrow). Sagittal fat-suppressed T2W MRI (C) shows hypointense areas at the periphery of the lesion (arrows) and edema in the surrounding soft tissues (arrowhead). Sagittal CT scan (D), performed on the same day as the MRI shows the characteristic rim ossifications (white arrows)

A 15-year-old girl with a history of chronic lumbar pain. Axial CT scan shows a mass typical of MO in the right paraspinal muscle, with peripheral ossifications (arrow head) and a low-density central area, indicating fatty metaplastic transformation (arrow)

Rapidly-increasing (within a single day) claudication and pain of the left hip in a 15-year-old girl. There was no history of trauma. Nonsteroidal anti-inflammatory drug therapy was initiated early. Initial anteroposterior radiographs of the left hip (A) are normal. Doppler USG at day 3 (B) shows a lesion with a central hypoechoic area (star), a hyperechoic rim (arrow), and a third hypoechoic area (large arrow). Pulsed Doppler (C) shows perilesional vascularization with arterial spectrum. Axial T2W (D) and coronal T1W contrast enhanced MRI (E) at day 5 show an enhancing rim (large arrows), suggesting a zone phenomenon. Axial contrast enhanced CT scan at day 20 (F) shows plain homogenous enhancement of the lesion (arrow). Unenhanced CT images did not reveal any ossification. No ossification was observed during follow-up and the lesion eventually disappeared

A 56-year-old male with intramuscular osteosarcoma of the right arm. Frontal radiographs of the right elbow (A) show irregular ossifications within the soft tissues (arrow). Axial CT scan (B) and sagittal contrast enhanced T1W MRI (C) show an intramuscular mass (arrowheads in B). In contrast to MO, the ossifications are seen at the lesion's heart (star) as a hyperdense mass (arrowhead in B) on CT scan and as a hypointense lesion on MRI (star in C). The MRI shows a large irregular lesion with global heterogeneous enhancement (arrowhead) and central areas of hypointensity, corresponding to the ossifications (star)
References
-
- Kransdorf MJ, Meis JM. From the archives of the AFIP.Extraskeletal osseous and cartilaginous tumors of the extremities. Radiographics. 1993;13:853–84. - PubMed
-
- Olsen KM, Chew FS. Tumoral calcinosis: Pearls, polemics, and alternative possibilities. Radiographics. 2006;26:871–85. - PubMed
-
- Nuovo MA, Norman A, Chumas J, Ackerman LV. Myositis ossificans with atypical clinical, radiographic, or pathologic findings: A review of 23 cases. Skeletal Radiol. 1992;21:87–101. - PubMed
-
- Spencer JD, Missen GA. Pseudomalignant heterotopic ossification (‘myositis ossificans’).Recurrence after excision with subsequent resorption. J Bone Joint Surg Br. 1989;71:317–9. - PubMed
-
- Mirra JM. Osseous soft tumors. In: Mirra JM, Picci P, Gold RH, editors. Bone tumors: Clinical, radiologic and pathologic correlations. London: Lea and Febiger; 1989. pp. 1549–86.