. 2012:2012:384936.
doi: 10.1100/2012/384936. Epub 2012 Apr 30.

Monocytes do not transdifferentiate into proper osteoblasts

Affiliations

Monocytes do not transdifferentiate into proper osteoblasts

Andreas Schmitt et al. ScientificWorldJournal. 2012.

Abstract

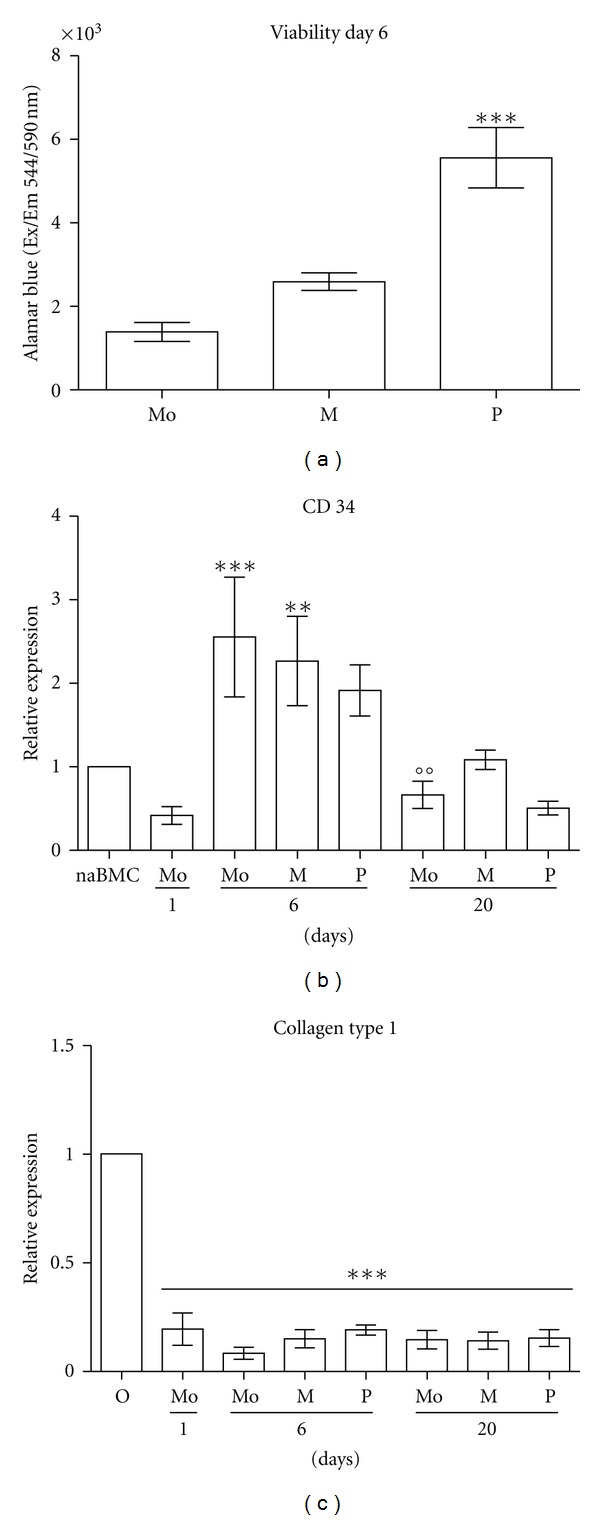
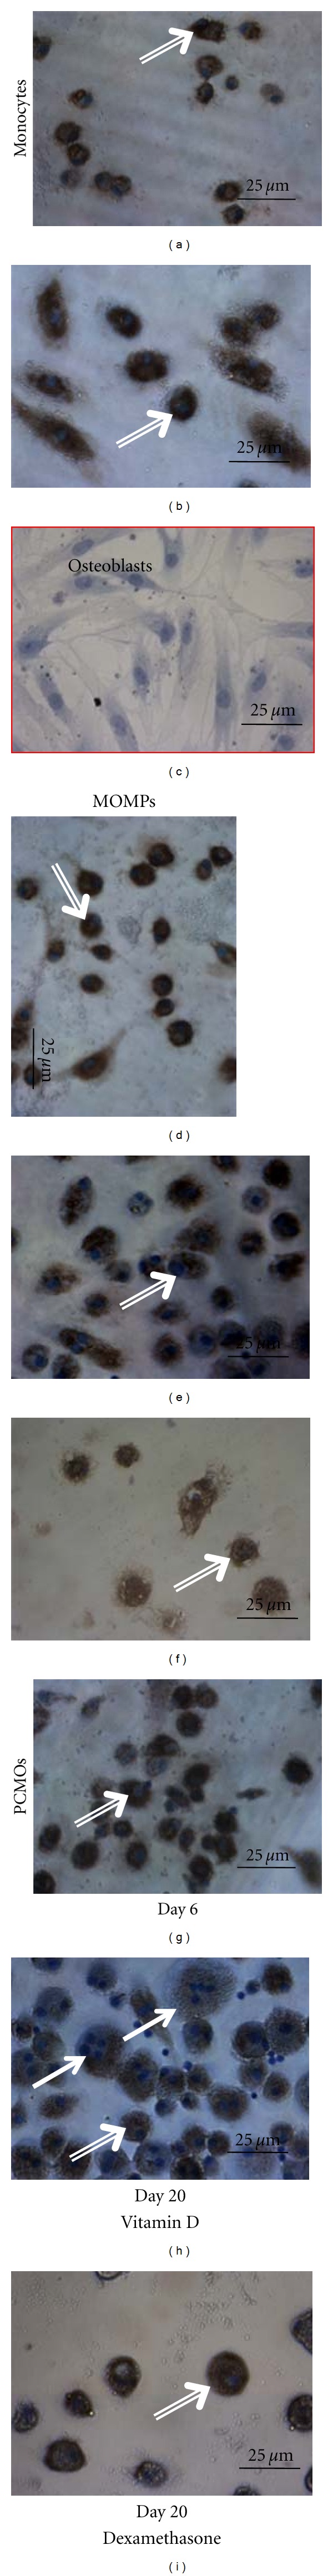
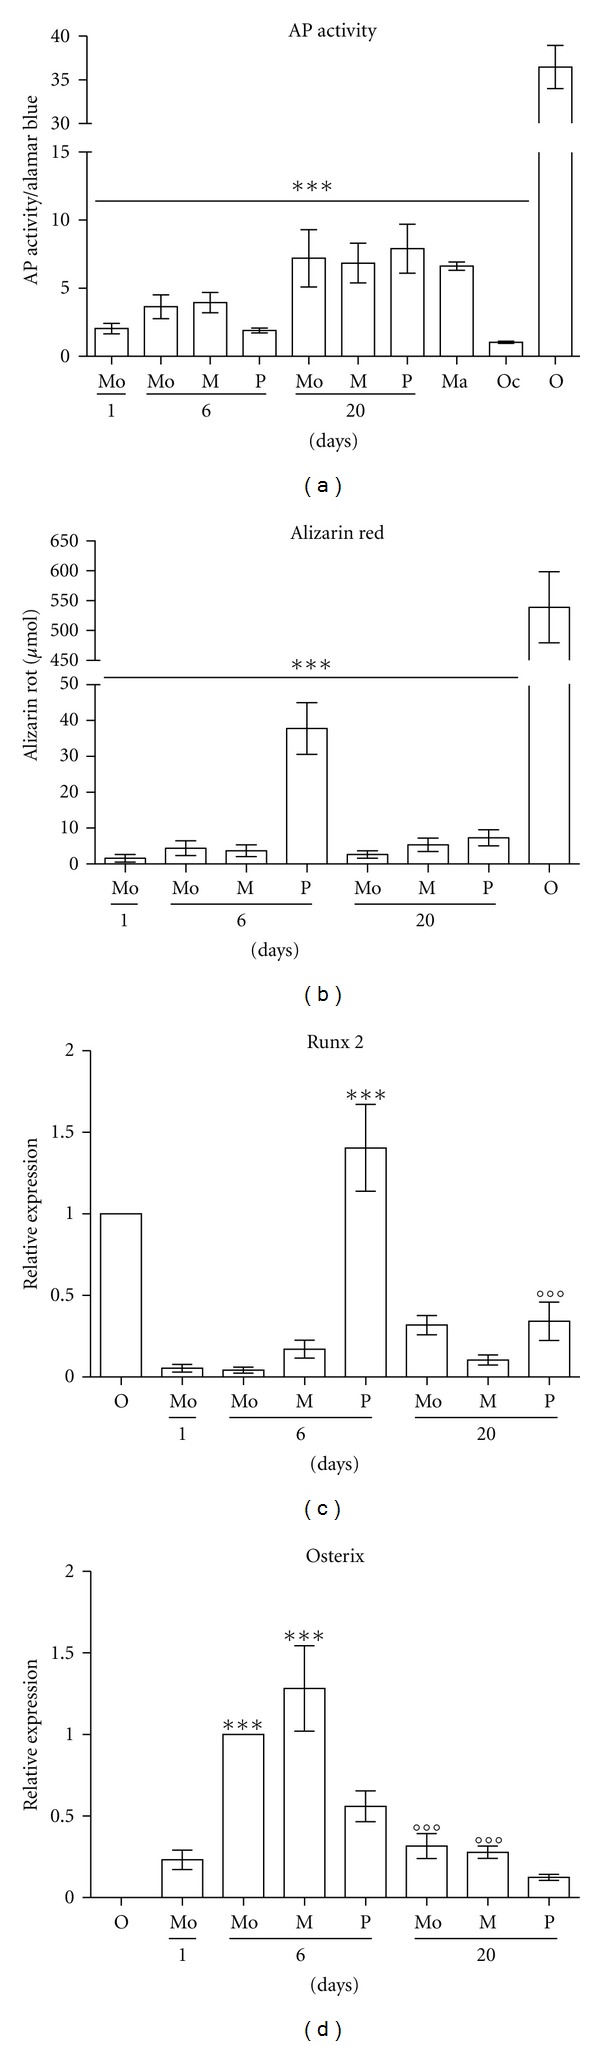
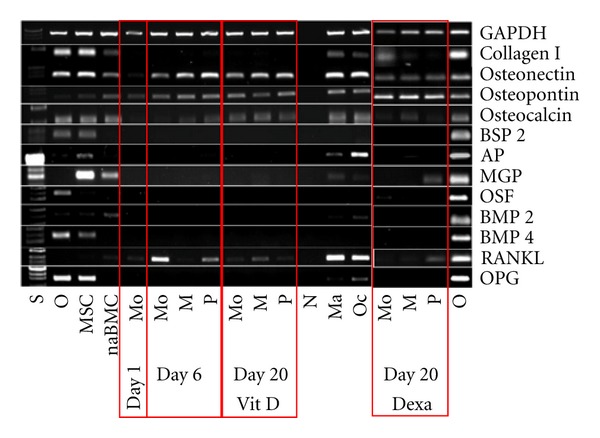
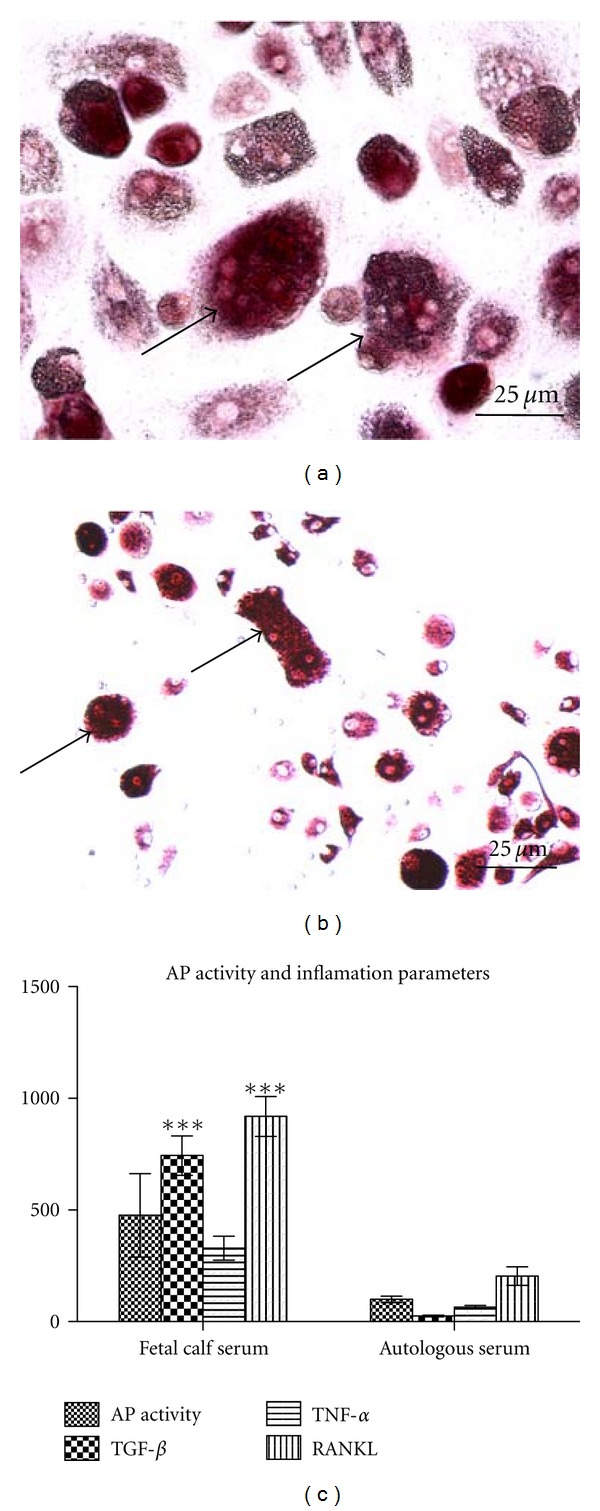
Recent publications suggested that monocytes might be an attractive cell type to transdifferentiate into various cellular phenotypes. Aim was, therefore, to evaluate the potential of blood monocytes to transdifferentiate into osteoblasts. Monocytes isolated from peripheral blood were subjected to two previously published treatments to obtain unique, multipotent cell fractions, named programmable cells of monocytic origin (PCMOs) and monocyte-derived mesenchymal progenitor cells (MOMPs). Subsequently, MOMPs and PCMOs were treated with osteogenic differentiation medium (including either vitamin D or dexamethasone) for 14 days. Regarding a variety of surface markers, no differences between MOMPs, PCMOs, and primary monocytes could be detected. The treatment with osteogenic medium neither resulted in loss of hematopoietic markers nor in adoption of mesenchymal phenotype in all cell types. No significant effect was observed regarding the expression of osteogenic transcription factors, bone-related genes, or production of mineralized matrix. Osteogenic medium resulted in activation of monocytes and appearance of osteoclasts. In conclusion, none of the investigated monocyte cell types showed any transdifferentiation characteristics under the tested circumstances. Based on our data, we rather see an activation and maturation of monocytes towards macrophages and osteoclasts.


Figures

Figure 1
Figure 1
Treatments to obtain PCMOs and MOMPs influence proliferation and expression of monocytes. (a) Human mononuclear cells (N = 4, n = 3) were cultivated without specific treatment (Mo), treated for 6 days to obtain MOMPs (M) or PCMOs (P). Viability was measured by Alamar blue assay on day 6. P shows a significantly higher viability than Mo (***P < 0.001). (b) Relative expression levels of CD34 measured by RT-PCR normalized to GAPDH and subsequently to expression of CD34 in nonadherent bone marrow cells (naBMCs) as internal control (N = 3, n = 3). Mo and M show a significantly higher expression of CD34 on day 6 than Mo on day 1 (**P < 0.01; ***P < 0.001). After osteogenic differentiation, CD34 levels in Mo decreased significantly in comparison to Mo on day 6 (°°P < 0.05). (c) Relative expression levels of collagen type 1 measured by RT-PCR normalized to GAPDH and subsequently to expression of collagen type 1 in primary osteoblasts (O) as internal control (N = 3, n = 3). Mo, M and P show expression of low levels of collagen type 1 on all days (***P < 0.001). Monocytes (Mo) day 1: freshly isolated monocytes; Mo, MOMP (M), and PCMO (P) day 6: cells after treatment; Mo, M, P day 20: cells after differentiation with vitamin D containing medium.
Figure 2
Figure 2
Differentiated monocytes (Mo), MOMPs (M), and PCMOs (P) express CD68. Representative picture of immunohistochemistry against CD68 in Mo, M, and P (N = 3, n = 3). After treatment to obtain MOMPs and PCMOs (“day 6;” first column) all cell types are positive for CD68. 20 days after the differentiation—either with vitamin D (column 2) or dexamethasone (column 3)—cells also expressed CD68, while primary osteoblasts proved to be negative for CD68. Magnification 200x. Following differentiation with vitamin D, high numbers of giant cells (marked with →) appear. Macrophage-like cells are marked with .
Figure 3
Figure 3
Weak response of monocyte-derived cells to differentiation. (a) Alkaline phosphatase (AP) activity [μmol/min] of monocyte-derived cells in comparison to primary osteoblasts, macrophages, and osteoclasts (N = 4, n = 3). AP activity [μM/min] normalized to cell amount determined by Alamar blue. (b) Alizarin red measurement [μmol] in monocyte-derived cells in comparison to primary osteoblasts (N = 4, n = 3). (c) Relative expression levels of Runx2 measured by RT-PCR normalized to GAPDH and subsequently to expression in primary osteoblasts as internal control (N = 3, n = 3). Runx2 expression significantly increases after treatment to obtain PCMOs (***P < 0.001). After the differentiation procedure, Runx2 expression in PCMOs decreases again (°°°P < 0.001) (d) relative expression levels of Osterix measured by RT-PCR normalized to GAPDH and subsequently to expression in monocytes after 6 days in culture as internal control (N = 3, n = 3). Osterix expression significantly increases after treatment to obtain MOMPs and after 6 days culture of control monocytes (***P < 0.001). After the differentiation procedure, osterix expression in both cell types decreases again (°°°P < 0.001). Monocytes (Mo) day 1: freshly isolated monocytes; Mo, MOMP (M), and PCMO (P) day 6: cells after treatment; Mo, M, P day 20: cells after differentiation with vitamin-D-containing medium. Macrophages (Ma), osteoclasts (Oc). (***P < 0.001).
Figure 4
Figure 4
Differentiation treatment did not change bone marker expression. Expression pattern on important osteoblast marker gens detected by RT-PCR. Freshly isolated monocytes (Mo); M and P after treatment to obtain MOMPs and PCMOs and untreated control cells (Mo, M, P “day 6”), after differentiation with medium containing vitamin D (Mo, M, P “day 20 Vit. D”), or with medium containing dexamethasone (Mo, M, P “day 20 Dexa”); controls: macrophages (Ma), osteoclasts (Oc), primary osteoblasts (O), mesenchymal stem cells (MSC), nonadherent bone marrow cells (naBMC), and negative control (N). (N = 3, n = 1).
Figure 5
Figure 5
Differentiation procedure activates and maturates monocytes. TRAP staining of giant cells (marked with →) occurring after differentiation treatment of PCMOs with medium containing vitamin D (a) and osteoclasts (b); magnification 200x. (c) Comparison of Alkaline phosphatase [μmol/min]-, TNF-alpha [pg/mL]-, TGF-beta [pg/mL], and RANKL-[pg/mL] levels normalized to SRB in PCMOs either isolated and differentiated in medium containing fetal calf or autologous serum (N = 5, n = 3). Differentiation performed with osteogenic medium containing vitamin D (*P < 0,05; ***P < 0.001).

Similar articles

Cited by

References

    1. Chamberlain G, Fox J, Ashton B, Middleton J. Concise review: mesenchymal stem cells: their phenotype, differentiation capacity, immunological features, and potential for homing. Stem Cells. 2007;25(11):2739–2749. - PubMed
    1. Bain BJ. Bone marrow biopsy morbidity and mortality. British Journal of Haematology. 2003;121(6):949–951. - PubMed
    1. Ehnert S, Seeliger C, Vester H, et al. Autologous serum improves yield and metabolic capacity of monocyte-derived hepatocyte-like cells: possible implication for cell transplantation. Cell Transplantation. 2011;20(9):1465–1477. - PubMed
    1. Seta N, Kuwana M. Human circulating monocytes as multipotential progenitors. Keio Journal of Medicine. 2007;56(2):41–47. - PubMed
    1. Zhao XY, Li W, Lv Z, et al. IPS cells produce viable mice through tetraploid complementation. Nature. 2009;461(7260):86–90. - PubMed

Publication types

Substances

LinkOut - more resources