

Cortical development of AMPA receptor trafficking proteins
- PMID: 22623912
- PMCID: PMC3353264
- DOI: 10.3389/fnmol.2012.00065
Cortical development of AMPA receptor trafficking proteins
Abstract
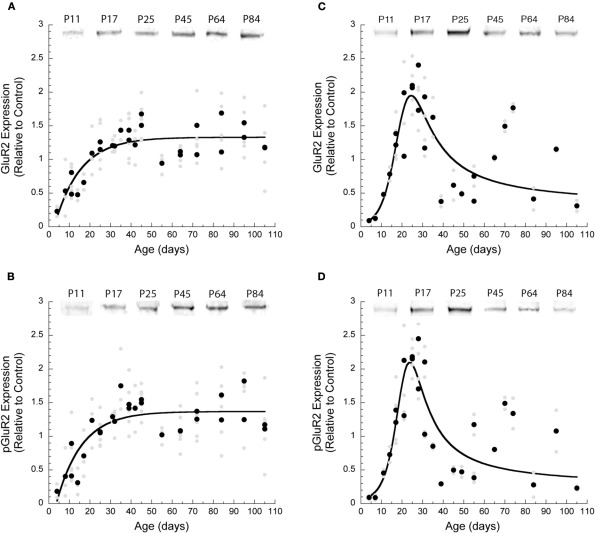
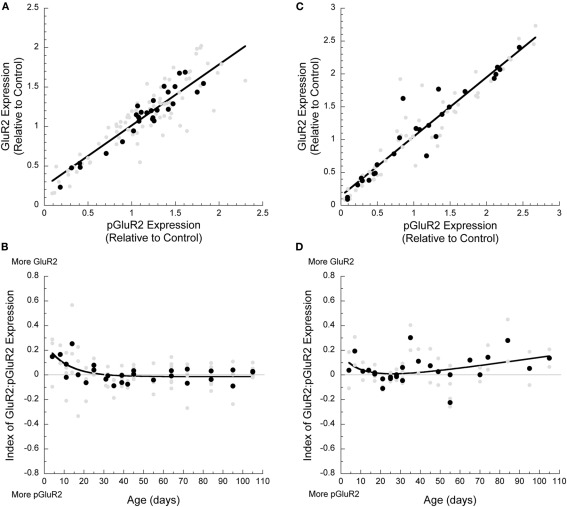
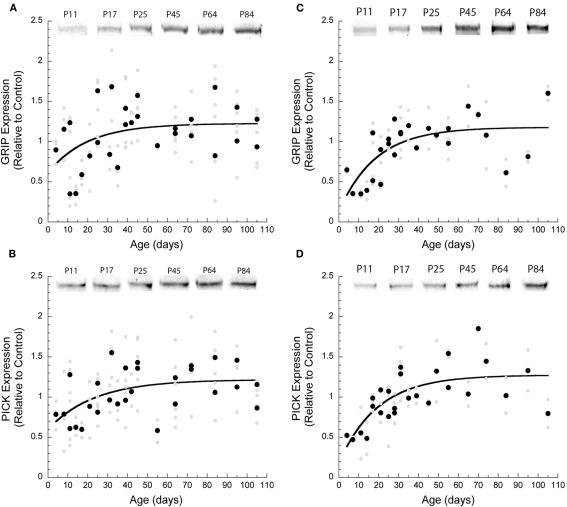
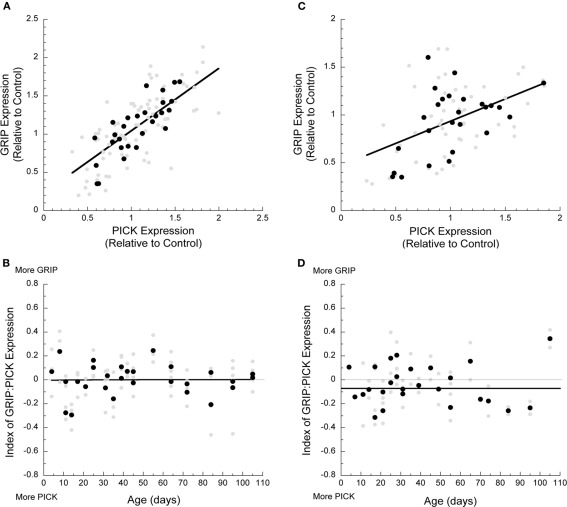
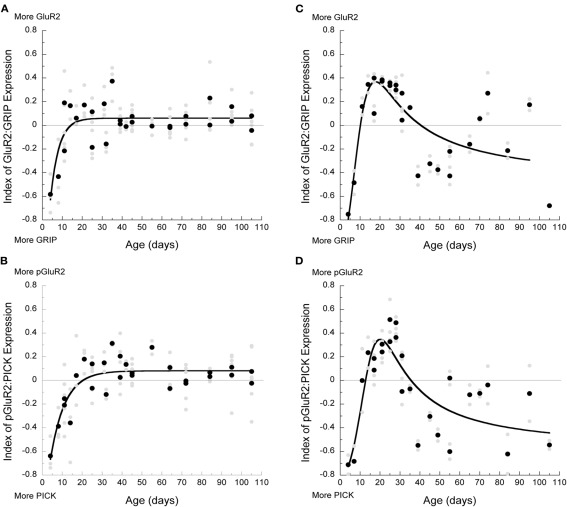
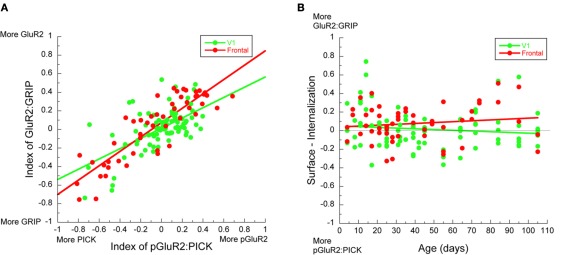
AMPA-receptor trafficking plays a central role in excitatory plasticity, especially during development. Changes in the number of AMPA receptors and time spent at the synaptic surface are important factors of plasticity that directly affect long-term potentiation (LTP), long-term depression (LTD), synaptic scaling, and the excitatory-inhibitory (E/I) balance in the developing cortex. Experience-dependent changes in synaptic strength in visual cortex (V1) use a molecularly distinct AMPA trafficking pathway that includes the GluA2 subunit. We studied developmental changes in AMPA receptor trafficking proteins by quantifying expression of GluA2, pGluA2 (GluA2serine880), GRIP1, and PICK1 in rat visual and frontal cortex. We used Western Blot analysis of synaptoneurosome preparations of rat visual and frontal cortex from animals ranging in age from P0 to P105. GluA2 and pGluA2 followed different developmental trajectories in visual and frontal cortex, with a brief period of over expression in frontal cortex. The over expression of GluA2 and pGluA2 in immature frontal cortex raises the possibility that there may be a period of GluA2-dependent vulnerability in frontal cortex that is not found in V1. In contrast, GRIP1 and PICK1 had the same developmental trajectories and were expressed very early in development of both cortical areas. This suggests that the AMPA-interacting proteins are available to begin trafficking receptors as soon as GluA2-containing receptors are expressed. Finally, we used all four proteins to analyze the surface-to-internalization balance and found that this balance was roughly equal across both cortical regions, and throughout development. Our finding of an exquisite surface-to-internalization balance highlights that these AMPA receptor trafficking proteins function as a tightly controlled system in the developing cortex.
Keywords: AMPA receptor; GRIP; PICK1; critical period; frontal cortex; synaptic plasticity; trafficking; visual cortex.
Figures
Similar articles
-
Activity-dependent synaptic GRIP1 accumulation drives synaptic scaling up in response to action potential blockade.Proc Natl Acad Sci U S A. 2015 Jul 7;112(27):E3590-9. doi: 10.1073/pnas.1510754112. Epub 2015 Jun 24. Proc Natl Acad Sci U S A. 2015. PMID: 26109571 Free PMC article.
-
Lipid binding regulates synaptic targeting of PICK1, AMPA receptor trafficking, and synaptic plasticity.J Neurosci. 2006 Mar 1;26(9):2380-90. doi: 10.1523/JNEUROSCI.3503-05.2006. J Neurosci. 2006. PMID: 16510715 Free PMC article.
-
Mice lacking GRIP1/2 show increased social interactions and enhanced phosphorylation at GluA2-S880.Behav Brain Res. 2017 Mar 15;321:176-184. doi: 10.1016/j.bbr.2016.12.042. Epub 2017 Jan 4. Behav Brain Res. 2017. PMID: 28063882 Free PMC article.
-
Coordination of AMPA receptor trafficking by Rab GTPases.Small GTPases. 2019 Nov;10(6):419-432. doi: 10.1080/21541248.2017.1337546. Epub 2017 Jul 5. Small GTPases. 2019. PMID: 28628388 Free PMC article. Review.
-
Synaptic plasticity and AMPA receptor trafficking.Ann N Y Acad Sci. 2003 Nov;1003:1-11. doi: 10.1196/annals.1300.001. Ann N Y Acad Sci. 2003. PMID: 14684431 Review.
Cited by
-
Synaptic Impairment in Layer 1 of the Prefrontal Cortex Induced by Repeated Stress During Adolescence is Reversed in Adulthood.Front Cell Neurosci. 2015 Nov 12;9:442. doi: 10.3389/fncel.2015.00442. eCollection 2015. Front Cell Neurosci. 2015. PMID: 26617490 Free PMC article.
-
Adolescent alcohol exposure reduces dopamine 1 receptor modulation of prelimbic neurons projecting to the nucleus accumbens and basolateral amygdala.Addict Neurosci. 2022 Dec;4:100044. doi: 10.1016/j.addicn.2022.100044. Epub 2022 Nov 17. Addict Neurosci. 2022. PMID: 36643604 Free PMC article.
-
Comparing development of synaptic proteins in rat visual, somatosensory, and frontal cortex.Front Neural Circuits. 2013 May 28;7:97. doi: 10.3389/fncir.2013.00097. eCollection 2013. Front Neural Circuits. 2013. PMID: 23754984 Free PMC article.
-
Frontal Cortex Proteome Perturbation after Juvenile Rat Secondhand Smoke Exposure.Proteomics. 2018 Dec;18(24):e1800268. doi: 10.1002/pmic.201800268. Epub 2018 Dec 6. Proteomics. 2018. PMID: 30474317 Free PMC article.
-
Adolescent alcohol exposure promotes mechanical allodynia and alters synaptic function at inputs from the basolateral amygdala to the prelimbic cortex.bioRxiv [Preprint]. 2025 Jan 21:2024.06.17.599360. doi: 10.1101/2024.06.17.599360. bioRxiv. 2025. Update in: Elife. 2025 May 08;13:RP101667. doi: 10.7554/eLife.101667. PMID: 38948749 Free PMC article. Updated. Preprint.
References
-
- Bakshi K., Gennaro S., Chan C. Y., Kosciuk M., Liu J., Stucky A., Trenkner E., Friedman E., Nagele R. G., Wang H. Y. (2009). Prenatal cocaine reduces AMPA receptor synaptic expression through hyperphosphorylation of the synaptic anchoring protein GRIP. J. Neurosci. 29, 6308–6319 10.1523/JNEUROSCI.5485-08.2009 - DOI - PMC - PubMed
LinkOut - more resources
Full Text Sources