Intracellular electric field and pH optimize protein localization and movement
- PMID: 22623963
- PMCID: PMC3356409
- DOI: 10.1371/journal.pone.0036894
Intracellular electric field and pH optimize protein localization and movement
Abstract
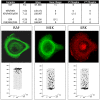
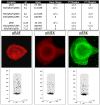
Mammalian cell function requires timely and accurate transmission of information from the cell membrane (CM) to the nucleus (N). These pathways have been intensively investigated and many critical components and interactions have been identified. However, the physical forces that control movement of these proteins have received scant attention. Thus, transduction pathways are typically presented schematically with little regard to spatial constraints that might affect the underlying dynamics necessary for protein-protein interactions and molecular movement from the CM to the N. We propose messenger protein localization and movements are highly regulated and governed by Coulomb interactions between: 1. A recently discovered, radially directed E-field from the NM into the CM and 2. Net protein charge determined by its isoelectric point, phosphorylation state, and the cytosolic pH. These interactions, which are widely applied in elecrophoresis, provide a previously unknown mechanism for localization of messenger proteins within the cytoplasm as well as rapid shuttling between the CM and N. Here we show these dynamics optimize the speed, accuracy and efficiency of transduction pathways even allowing measurement of the location and timing of ligand binding at the CM--previously unknown components of intracellular information flow that are, nevertheless, likely necessary for detecting spatial gradients and temporal fluctuations in ligand concentrations within the environment. The model has been applied to the RAF-MEK-ERK pathway and scaffolding protein KSR1 using computer simulations and in-vitro experiments. The computer simulations predicted distinct distributions of phosphorylated and unphosphorylated components of this transduction pathway which were experimentally confirmed in normal breast epithelial cells (HMEC).
Conflict of interest statement
Figures


Similar articles
-
Coulomb interactions between cytoplasmic electric fields and phosphorylated messenger proteins optimize information flow in cells.PLoS One. 2010 Aug 11;5(8):e12084. doi: 10.1371/journal.pone.0012084. PLoS One. 2010. PMID: 20711447 Free PMC article.
-
Modeling the signaling endosome hypothesis: why a drive to the nucleus is better than a (random) walk.Theor Biol Med Model. 2005 Oct 19;2:43. doi: 10.1186/1742-4682-2-43. Theor Biol Med Model. 2005. PMID: 16236165 Free PMC article.
-
Spatial modeling of the membrane-cytosolic interface in protein kinase signal transduction.PLoS Comput Biol. 2018 Apr 9;14(4):e1006075. doi: 10.1371/journal.pcbi.1006075. eCollection 2018 Apr. PLoS Comput Biol. 2018. PMID: 29630597 Free PMC article.
-
Signal-transducing protein phosphorylation cascades mediated by Ras/Rho proteins in the mammalian cell: the potential for multiplex signalling.Biochem J. 1996 Sep 15;318 ( Pt 3)(Pt 3):729-47. doi: 10.1042/bj3180729. Biochem J. 1996. PMID: 8836113 Free PMC article. Review.
-
Nucleocytoplasmic shuttling revealed by FRAP and FLIP technologies.Curr Opin Biotechnol. 2005 Feb;16(1):28-34. doi: 10.1016/j.copbio.2004.11.002. Curr Opin Biotechnol. 2005. PMID: 15722012 Review.
Cited by
-
Cytoplasmic electric fields and electroosmosis: possible solution for the paradoxes of the intracellular transport of biomolecules.PLoS One. 2013 Apr 16;8(4):e61884. doi: 10.1371/journal.pone.0061884. Print 2013. PLoS One. 2013. PMID: 23613967 Free PMC article. Review.
-
Pyruvate sensitizes pancreatic tumors to hypoxia-activated prodrug TH-302.Cancer Metab. 2015 Jan 29;3(1):2. doi: 10.1186/s40170-014-0026-z. eCollection 2015. Cancer Metab. 2015. PMID: 25635223 Free PMC article.
-
Tumor treating fields: An emerging treatment modality for thoracic and abdominal cavity cancers.Transl Oncol. 2022 Jan;15(1):101296. doi: 10.1016/j.tranon.2021.101296. Epub 2021 Nov 27. Transl Oncol. 2022. PMID: 34847422 Free PMC article. Review.
-
Signal transmission through elements of the cytoskeleton form an optimized information network in eukaryotic cells.Sci Rep. 2019 Apr 16;9(1):6110. doi: 10.1038/s41598-019-42343-2. Sci Rep. 2019. PMID: 30992457 Free PMC article.
-
Genomics, molecular and evolutionary perspective of NAC transcription factors.PLoS One. 2020 Apr 10;15(4):e0231425. doi: 10.1371/journal.pone.0231425. eCollection 2020. PLoS One. 2020. PMID: 32275733 Free PMC article.
References
-
- Friday BB, Adjei AA. Advances in Targeting the Ras/Raf/MEK/Erk Mitogen-Activated Protein Kinase Cascade with MEK Inhibitors for Cancer Therapy. Clin Cancer Res. 2008;15:342–6. - PubMed
-
- Fujioka A, Terai K, Itoh R E, Aoki K, Nakamura T, et al. Dynamics of the Ras/ERK MAPK cascade as monitored by fluorescent probes. Journal of Biological Chemistry. 2009;281:8917–8927. - PubMed
Publication types
MeSH terms
Substances
Grants and funding
LinkOut - more resources
Full Text Sources
Medical
Research Materials
Miscellaneous

