. 2012;7(5):e37144.
doi: 10.1371/journal.pone.0037144. Epub 2012 May 18.

Mitochondrial and plasma membrane pools of stomatin-like protein 2 coalesce at the immunological synapse during T cell activation

Affiliations

Mitochondrial and plasma membrane pools of stomatin-like protein 2 coalesce at the immunological synapse during T cell activation

Darah A Christie et al. PLoS One. 2012.

Abstract

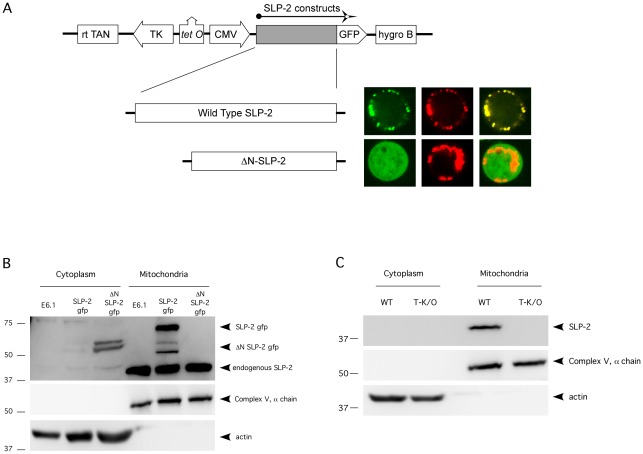
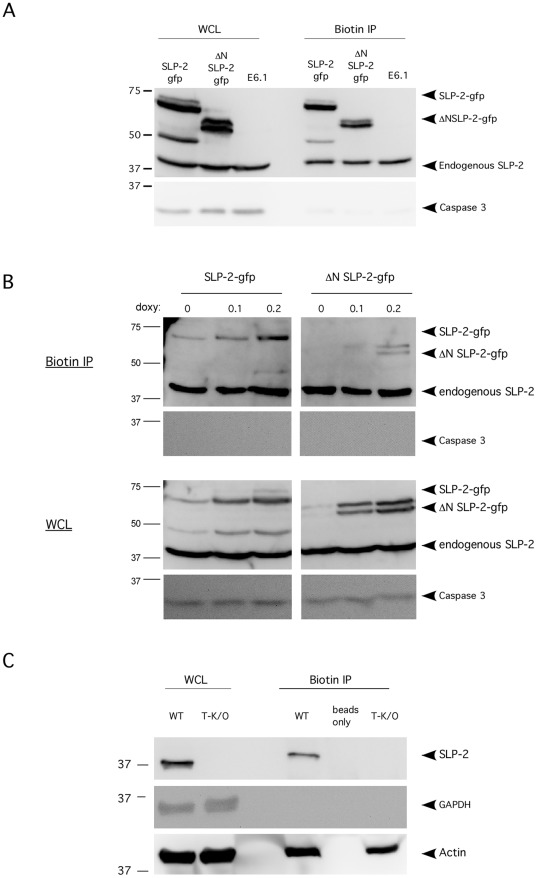
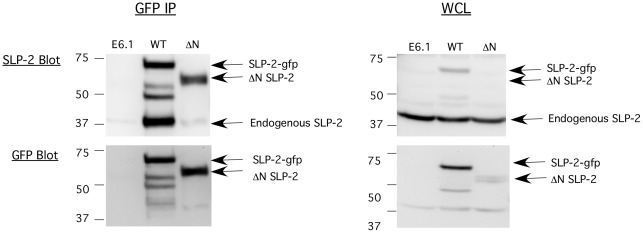
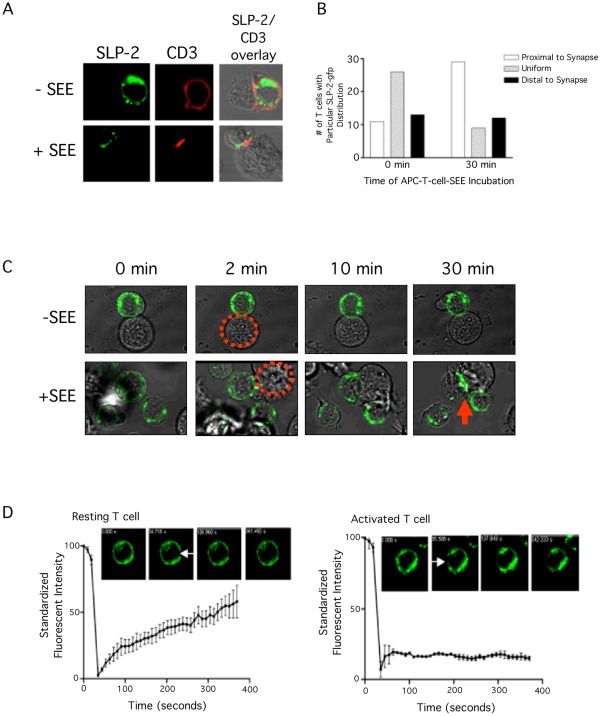
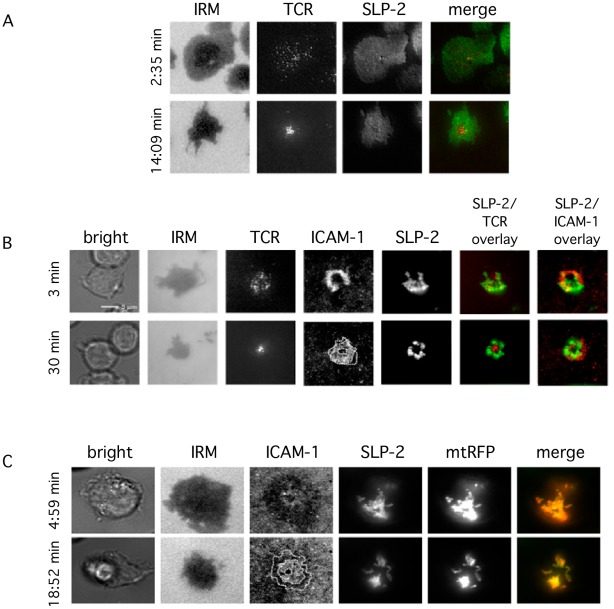
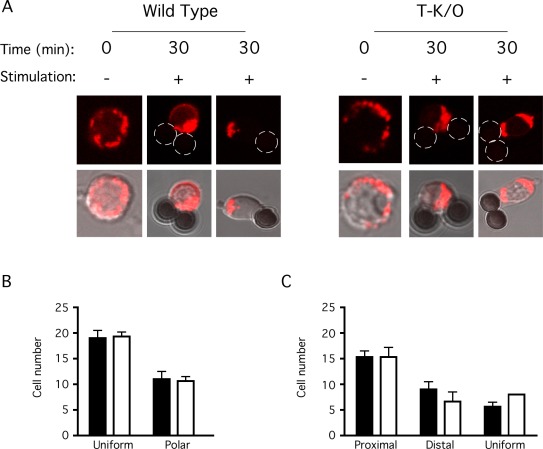
Stomatin-like protein 2 (SLP-2) is a member of the stomatin-prohibitin-flotillin-HflC/K (SPFH) superfamily. Recent evidence indicates that SLP-2 is involved in the organization of cardiolipin-enriched microdomains in mitochondrial membranes and the regulation of mitochondrial biogenesis and function. In T cells, this role translates into enhanced T cell activation. Although the major pool of SLP-2 is associated with mitochondria, we show here that there is an additional pool of SLP-2 associated with the plasma membrane of T cells. Both plasma membrane-associated and mitochondria-associated pools of SLP-2 coalesce at the immunological synapse (IS) upon T cell activation. SLP-2 is not required for formation of IS nor for the re-localization of mitochondria to the IS because SLP-2-deficient T cells showed normal re-localization of these organelles in response to T cell activation. Interestingly, upon T cell activation, we found the surface pool of SLP-2 mostly excluded from the central supramolecular activation complex, and enriched in the peripheral area of the IS where signalling TCR microclusters are located. Based on these results, we propose that SLP-2 facilitates the compartmentalization not only of mitochondrial membranes but also of the plasma membrane into functional microdomains. In this latter location, SLP-2 may facilitate the optimal assembly of TCR signalosome components. Our data also suggest that there may be a net exchange of membrane material between mitochondria and plasma membrane, explaining the presence of some mitochondrial proteins in the plasma membrane.


Conflict of interest statement

Competing Interests: The authors have declared that no competing interests exist.

Figures

Figure 1
Figure 1. SLP-2 is a mitochondrial protein.
A) Full-length SLP-2-gfp and ΔN-SLP-2-gfp were subcloned into a doxycycline-inducible vector and transfected into Jurkat T cells. These stable transfectants were imaged by confocal microscopy for SLP-2-gfp (first column of micrographs – green), or after staining with MitoTracker Red (second column of micrographs – red). The third colum of photomicrographs show overlapping of red and green signals as yellow signal. B) Mitochondrial and cytosolic fractions of parental, SLP-2-gfp and ΔN-SLP-2-gfp T cell transfectants were isolated by differential centrifugation and immunoblotted for SLP-2, the α-subunit of ATP synthase and actin. C) Mitochondrial and cytosolic fractions were isolated from T cells of wild type mice and T-cell specific SLP-2 conditional knockout mice and blotted as in B. These results are representative of at least 3 independent experiments, and of more than 100 imaged cells.
Figure 2
Figure 2. A small pool of SLP-2 is associated with the plasma membrane.
A) Intact parental Jurkat T cells, as well as Jurkat T cells stably transfected with full length SLP-2-gfp or ΔN-SLP-2-gfp were biotinylated. Next, cells were lysed and surface proteins were immunoprecipitated with an antibody against biotin. The immunoprecipitate samples (Biotin ip) were immunoblotted for SLP-2 to detect the pool of SLP-2 associated with surface molecules. Whole cell lysates (WCL) from the transfectants were blotted to show expression levels of the transgenes. Samples were also blotted for caspase 3 as a negative control for surface protein pull-down. B) Increasing levels of SLP-2-gfp or ΔN-SLP-2-gfp were induced with increasing concentrations of doxycycline and biotin immunoprecipitation was performed. Whole cell lysates (WCL) and biotin immunoprecipitates (biotin ip) were blotted as in A. C) T cells isolated from wild type and SLP-2 T-K/O mice were analyzed by biotin immunoprecipitation and blotted as in A. Samples were also blotted for actin as a loading control for SLP-2 T-K/O samples and also for GAPDH as a negative control for surface protein pull-down. These results are representative of at least 3 independent experiments.
Figure 3
Figure 3. Homo-oligomerization of SLP-2.
Parental Jurkat T cells and Jurkat T cells stably transfected with SLP-2-gfp or ΔN-SLP-2-gfp were lysed. Lysates were used for immunoprecipitation with anti-GFP antibodies (GFP ip), and immunoblotted serially for SLP-2 and gfp. Whole cell lysates (WCL) were also blotted to show expression levels of endogenous SLP-2 and the SLP-2 transgenes. This result is representative of at least 3 independent experiments.
Figure 4
Figure 4. SLP-2 polarizes to the immunological synapse during T cell activation.
A) Stable SLP-2-gfp-transfected E6.1 Jurkat T cells were cultured with APC in the presence (+SEE) or absence (−SEE) of SEE and examined by confocal microscopy for the formation of putative synapses (identified as CD3-positive red clusters at the interface between T cell and APC) and for the location of SLP-2-gfp signal (green). Images are representative of at least 50 putative IS. Concomitant studies done with control transfected T cells demonstrated that expression of SLP-2-gfp did not interfere with IS formation. B) Confocal images collected from 50 putative IS images (in A) were analyzed for SLP-2-gfp intracellular localization. SLP-2-gfp signal in un-stimulated (0 min) or stimulated cells (30 min) was classified as predominantly proximal to the IS (white bars), predominantly distal to the IS (black bars), or diffuse throughout the cell (grey bars). C) Redistribution of SLP-2 during T cell activation is shown by a series of videomicroscopy capture images during IS formation. The dotted circle outlines the APC interacting with the Jurkat T cell and the arrow indicates the mature IS with the SLP-2 localization. See Video S1. D) SLP-2-gfp-transfected Jurkat T cells were stimulated with antibodies against CD3 and examined by confocal microscopy. Photobleaching was induced at the arrow-indicated site and regaining of the signal at that site was monitored for 6 minutes at 20 second intervals. Non-specific distribution is documented by progressive regaining of signal with non-bleached SLP-2, while active distribution correlates with lack of regaining of signal. See Videos S2 and S3 for dynamic data.
Figure 5
Figure 5. Redistribution of plasma membrane-associated SLP-2 and mitochondria-associated SLP-2 during immunological synapse formation.
Jurkat T cells stably expressing SLP-2-gfp were incubated on planar membranes containing ICAM-1 and anti-CD3 to induce immunosynapse formation. Cells were imaged at early (<5 min) and late (15–30 min) stages of immunosynapse formation to demonstrate SLP-2 redistribution upon TCR ligation. A) Plasma membrane-associated SLP-2 redistribution during immunosynapse formation was imaged by TIRFM, to eliminate signal from the mitochondrial pool of SLP-2. Cell contact with the planar membrane was imaged by IRM, TCR images were obtained by wide-field fluorescence microscopy and the image overlay represents SLP-2-gfp as green and TCR as red. B) Total SLP-2-gfp, including both plasma membrane-associated and mitochondrial pools was imaged at early and late stages of immunosynapse formation. The bright field image shows cells being imaged, IRM images show contact with the bilayer as dark areas, and the TCR, ICAM-1 and SLP-2-gfp fluorescence channels are shown in gray scale and two red-green merges (green is always SLP-2). The dotted lines in the ICAM-1 picture represent, from the periphery to the centre of the picture, the outer boundaries of the distal SMAC, of the pSMAC, and of the cSMAC. Images are representative 3 separate experiments. C) SLP-2-gfp expressing Jurkat cells were transfected with mitochondria-targeted RFP to verify mitochondrial localization of intracellular SLP-2-gfp. Images were obtained by wide-field fluorescence microscopy and are representative of three separate experiments. The dotted lines in the ICAM-1 image are as described in B. The percentage of cells showing segregation of the mitochondrial pool of SLP-2 away from the cSMAC is shown in table 1 and this organization of SLP-2 into the pSMAC requires anti-CD3 ligation (table 2).
Figure 6
Figure 6. SLP-2-deficient T cells show normal mitochondrial recruitment upon T cell stimulation.
T cells were isolated from wild type and SLP-2 T-K/O (T-K/O) mice and stained with MitoTracker Red. Stained cells were plated on poly-L-lysine coated confocal dishes and incubated for 10 minutes to promote adherence. Cells were stimulated for 30 minutes with anti-CD3 and anti-CD28 antibody coated beads or left unstimulated. Cells were then fixed and imaged by confocal microscopy. These images are representative of at least 100 individual cells, imaged in three independent experiments. A) Representative confocal images are shown for wild type and SLP-2-deficient T cells in the absence (0 min) and presence (30 min) of T cell stimulation (2 different cells for each). Mitochondria are shown in red and stimulating beads can be seen in the light image overlay. B) The location of the mitochondria was quantified in un-stimulated wild type (black bars) and SLP-2-deficient (white bars) T cells was quantified as either a polar distribution with mitochondria being clustered together at one end of the cell or a uniform distribution, with mitochondria located throughout the entire cell. C) The location of the mitochondria in stimulated wild type and SLP-2-deficient T cells was quantified as proximal to the stimulating bead, distal to the bead or uniformly distributed throughout the cytoplasm, in a manner similar to that in figure 4. These plots represent an average of 3 independent experiments, in which 30 cells for each group were counted.

References

    1. Da Cruz S, Xenarios I, Langridge J, Vilbois F, Parone PA, et al. Proteomic analysis of the mouse liver mitochondrial inner membrane. J Biol Chem. 2003;278:41566–41571. - PubMed
    1. Chevallet M, Lescuyer P, Diemer H, van Dorsselaer A, Leize-Wagner E, et al. Alterations of the mitochondrial proteome caused by the absence of mitochondrial DNA: A proteomic view. Electrophoresis. 2006;27:1574–1583. - PMC - PubMed
    1. Rezaul K, Wu L, Mayya V, Hwang SI, Han D. A systematic characterization of mitochondrial proteome from human T leukemia cells. Mol Cell Proteomics. 2005;4:169–181. - PMC - PubMed
    1. Taylor SW, Fahy E, Zhang B, Glenn GM, Warnock DE, et al. Characterization of the human heart mitochondrial proteome. Nat Biotechnol. 2003;21:281–286. - PubMed
    1. Hajek P, Chomyn A, Attardi G. Identification of a novel mitochondrial complex containing mitofusin 2 and stomatin-like protein 2. J Biol Chem. 2007;282:5670–5681. - PubMed

Publication types