. 2012;7(5):e37311.
doi: 10.1371/journal.pone.0037311. Epub 2012 May 18.

Homeostatic regulation of Salmonella-induced mucosal inflammation and injury by IL-23

Affiliations

Homeostatic regulation of Salmonella-induced mucosal inflammation and injury by IL-23

Muyiwa Awoniyi et al. PLoS One. 2012.

Abstract

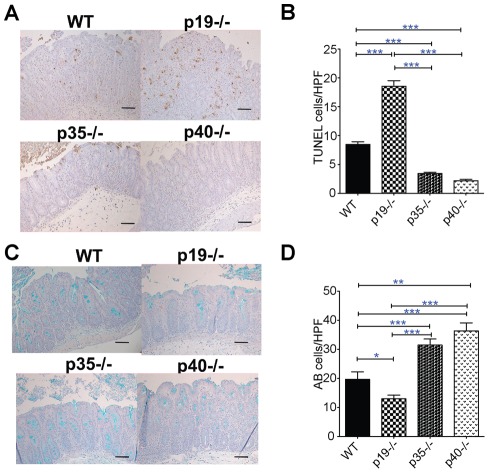
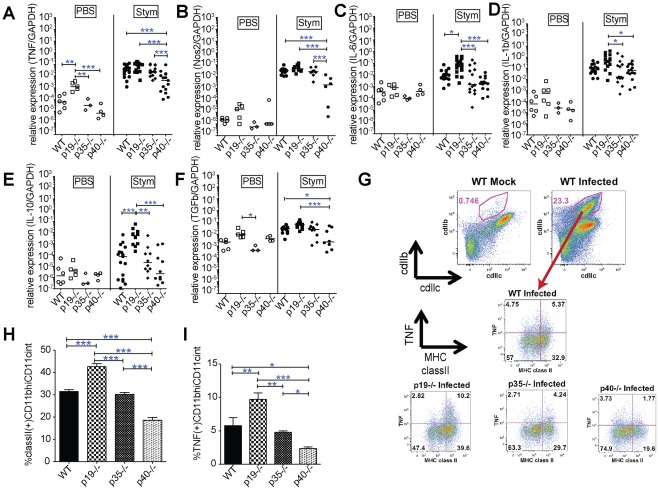
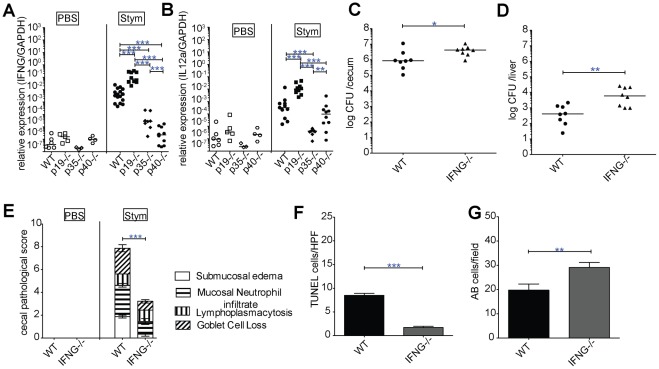
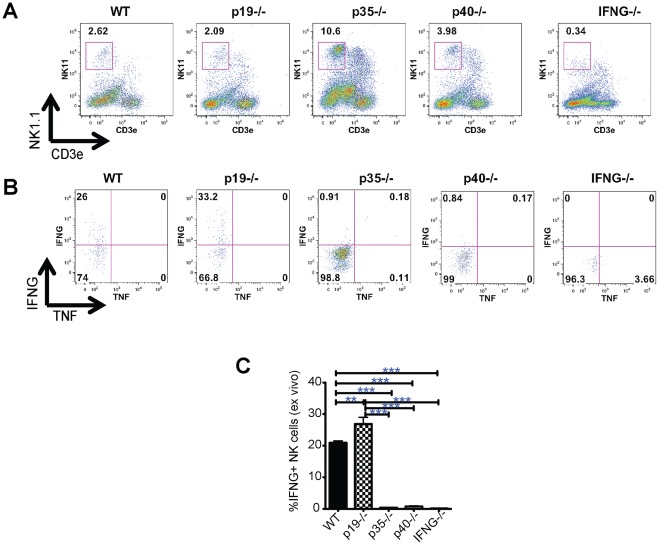
IL-12 and IL-23 regulate innate and adaptive immunity to microbial pathogens through influencing the expression of IFN-γ, IL-17, and IL-22. Herein we define the roles of IL-12 and IL-23 in regulating host resistance and intestinal inflammation during acute Salmonella infection. We find that IL-23 alone is dispensable for protection against systemic spread of bacteria, but synergizes with IL-12 for optimal protection. IL-12 promotes the production of IFN-γ by NK cells, which is required for resistance against Salmonella and also for induction of intestinal inflammation and epithelial injury. In contrast, IL-23 controls the severity of inflammation by inhibiting IL-12A expression, reducing IFN-γ and preventing excessive mucosal injury. Our studies demonstrate that IL-23 is a homeostatic regulator of IL-12-dependent, IFN-γ-mediated intestinal inflammation.


Conflict of interest statement

Competing Interests: The authors have declared that no competing interests exist.

Figures

Figure 1
Figure 1. IL-12 and IL-23 are required for resistance against S. Typhimurium (Stym).
WT, p19−/−(no IL-23), p35−/−(no IL-12), and p40−/− (no IL-12/-23) mice were orally infected with 1×10³ CFU of S. Typhimurium 1 day after 20 mg streptomycin pretreatment. (A) Cecum and (B) liver were collected from infected mice 3 days post infection. Organs were weighed, homogenized and plated to determine CFU/organ. Bars represent the median bacterial load. Pooled data from 3 separate experiments are shown in A and B. (C) Representative ceca are shown for each group at 3 d after oral inoculation with PBS (mock) or Stym. A one centimeter bar indicates the magnification. (D) 10X and (E) 40X magnification of histopathology of H&E stained cecal sections of WT, p19−/−, p35−/−, and p40−/− mice 3 d after infection. Bar in (D) represents 100 micron and (E) 20 micron. Notched arrow-heads in (E) indicate cell death. (F) Blinded scoring was performed on H&E-stained cecal sections. The inflammatory score equals the sum of the separate categories (edema, PMN infiltration, lymphoplasmacytosis, and goblet cell loss). (G) H&E stained cecal sections from WT, p19−/−, p35−/−, and p40 mice 3 d after infection were blinded and qualitatively assessed for cell death: 0 (no significant), 1 (focal), 2 (mild), 3 (severe) in the basal epithelium. At least 3 mock treated animals and at least 13 infected mice from each group from 3 separate experiments were scored in 1F and 1G. Mean values ± SE are shown. Statistical significance was determined using the one way ANOVA test with Bonferroni post test (A, B, F and G). *: p<0.05, **: p<0.01, ***: p<0.001.
Figure 2
Figure 2. Loss of IL-23 in the context of functional IL-12 results in increased epithelial cell death and loss of goblet cells.
(A) 20X magnification of TUNEL-positive (brown) or (C) Alcian Blue (blue) cells of representative infected cecal sections. The bar in (A) and (C) represents 20 micron. The mean ± SE of TUNEL (B) positive cells per high-power field was quantified from cecal sections WT (n = 4), p19−/− (n = 5), p35−/− (n = 6) and p40−/− (n = 3) mice. The mean ± SE Alcian Blue positive cells were quantified per high-power field from cecal sections of the same mice (n = 3 per group). Statistical significance for (B and D) was determined using the one way ANOVA followed by Bonferroni post test. *: p<0.05, **: p<0.01, ***: p<0.001.
Figure 3
Figure 3. IL-17 has cytoprotective activity during Salmonella induced injury.
(A) Changes in IL-17A, (B) IL-22 (C) Reg3γ gene expression elicited 3d after oral PBS (mock) or S. Typhimurium (Stym) infection in the ceca of WT, p19−/−, p35−/−, p40−/− mice were measured by qPCR. Data are expressed as the ratio of mRNA levels of the gene of interest divided by GAPDH expression from the same RNA. Pooled data from 3 separate experiments are shown. (D) Cecum and (E) liver were collected from IL-17RC−/− and C57BL/6 mice congenic for Slc11a1 G169/G169 three days post infection. Organ homogenates were diluted and plated to determine CFU/organ. Bars represent the median bacterial load from two experiments. (F) Histological changes and (G) basal cell death at 3 d post-infection from infected WT and IL-17RC−/− H&E stained cecal sections were done as described in Fig. 2. (H) 20× magnification of TUNEL-positive (brown) cells of representative infected cecal sections. Bar in (H) represents 50 micron. (I) TUNEL positive cells were quantified per high-power field in the cecal sections from a minimum of 3 infected mice and two experiments. Statistical significance was determined using one way ANOVA with Bonferroni post test for A-C, Mann Whitney for D&E, and unpaired Student's t-test for F, G & I. *: p<0.05, **: p<0.01, ***: p<0.001.
Figure 4
Figure 4. IL-23 limits IL-12 dependent pro-inflammatory cytokine production and the activation of gut mononuclear phagocytes.
(A) TNF, (B) Nos2, (C) IL-6, (D) IL-1β, (E) IL-10 and (F) TGF-β cecal gene expression at 3 d after oral S. Typhimurium or mock infection of WT, p19−/−, p35−/−, p40−/− mice was determined by qPCR. Data are expressed as the ratio of mRNA levels of the gene of interest divided by GAPDH expression from the same RNA. Bars show median values and the data are pooled from 3 separate infections. (G) Following mock or Salmonella infection, lamina propria (LP) cells were isolated from the cecum and colon of C57BL/6 mice as detailed in Materials and Methods section. LP cells were treated for 4 hrs ex vivo with BFA, followed by surface staining with CD11c, CD11b and class II MHC, followed by intracellular TNF. The CD11bhi CD11c+ cell population (red gates) were the primary TNF producers. TNF and class II MHC expression by the CD11bhi CD11c+ cell populations is shown for representative animals in the lower panels. Quantification of CD11bhi/CD11c+ positive cells for (I) MHC classIIhi expression and (J) MHC classIIhi TNF+ populations. Statistical significance was determined using one way ANOVA followed by Bonferroni post test. *: p<0.05, **: p<0.01, ***: p<0.001.
Figure 5
Figure 5. IL-23 inhibits Salmonella induced IL-12 dependent IFN-γ mediated inflammation.
(A) IFN-γ, and (B) IL-12a (IL-12p35) cecal gene expression at 3 d after oral WT Salmonella infection +/− mock treated mice from WT, p19−/−, p35−/−, p40−/− mice was determined by qPCR. Bars show the median and the data are pooled from 3 separate infections. (C) Cecum and (D) liver were collected from WT and IFN-γ−/− 3 days post infection. Organ homogenates were diluted and plated to determine CFU/organ. Bars represent the median bacterial load and the data are pooled from 2 separate infections. (E) Histologic changes were quantified on H&E-stained cecal sections as described in Fig. 2. (F) TUNEL and (G) AB positive cells were quantified per high-power field in the ceca of at minimum 3 infected mice/group. Results are expressed in mean ± SE. Statistical significance was determined using one way ANOVA followed by Bonferroni post test for A and B, the Mann-Whitney test was used for C and D, and unpaired Student's t-test was used for E-G. *: p<0.05, **: p<0.01, ***: p<0.001.
Figure 6
Figure 6. IL-23 inhibits Salmonella induced IFN-γ production by lamina propria NK cells.
(A) LP populations isolated from WT, p19−/−, p35−/−, p40−/− and IFN-γ−/− mice were stained for surface expression of NK1.1 and CD3ε; numbers indicate the percentage of cells in the gated box. (B) Intracellular production of IFN-γ and TNF is shown for NK cells (the NK1.1+CD3 population gated in A). (C) The percentage of LP IFN-γ+ NK cells were quantified for the aforementioned mice at 3 d Salmonella infection. Plotted are the mean ± SE for 3 mice per condition. Statistical significance was determined using the one-way ANOVA followed by Bonferroni post test. *: p<0.05, **: p<0.01, ***: p<0.001

Similar articles

Cited by

References

    1. Mead PS, Slutsker L, Dietz V, McCaig LF, Bresee JS, et al. Food-related illness and death in the United States. Emerg Infect Dis. 1999;5:607–625. - PMC - PubMed
    1. Wallis TS, Galyov EE. Molecular basis of Salmonella-induced enteritis. Mol Microbiol. 2000;36:997–1005. - PubMed
    1. McGovern VJ, Slavutin LJ. Pathology of salmonella colitis. Am J Surg Pathol. 1979;3:483–490. - PubMed
    1. Filipe-Santos O, Bustamante J, Chapgier A, Vogt G, de Beaucoudrey L, et al. Inborn errors of IL-12/23- and IFN-gamma-mediated immunity: molecular, cellular, and clinical features. Semin Immunol. 2006;18:347–361. - PubMed
    1. Lehmann J, Bellmann S, Werner C, Schroder R, Schutze N, et al. IL-12p40-dependent agonistic effects on the development of protective innate and adaptive immunity against Salmonella enteritidis. J Immunol. 2001;167:5304–5315. - PubMed

Publication types

MeSH terms