. 2012 May 15;21(5):680-693.
doi: 10.1016/j.ccr.2012.03.043.

In vivo imaging of tumor-propagating cells, regional tumor heterogeneity, and dynamic cell movements in embryonal rhabdomyosarcoma

Affiliations

In vivo imaging of tumor-propagating cells, regional tumor heterogeneity, and dynamic cell movements in embryonal rhabdomyosarcoma

Myron S Ignatius et al. Cancer Cell. .

Abstract

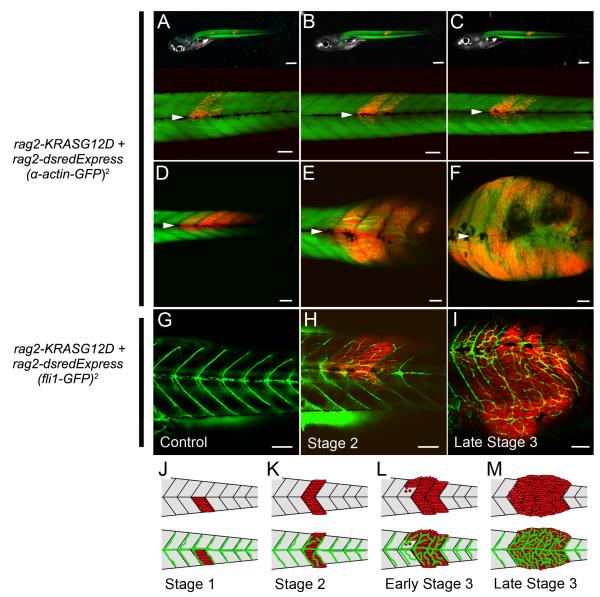
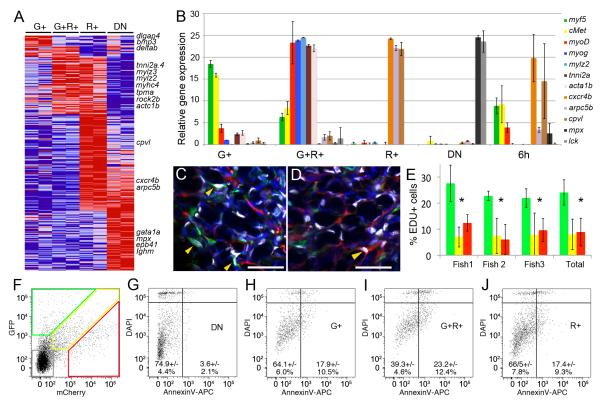
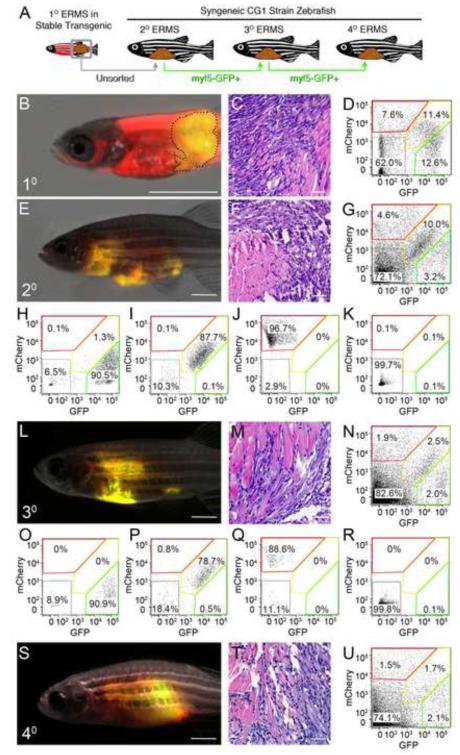
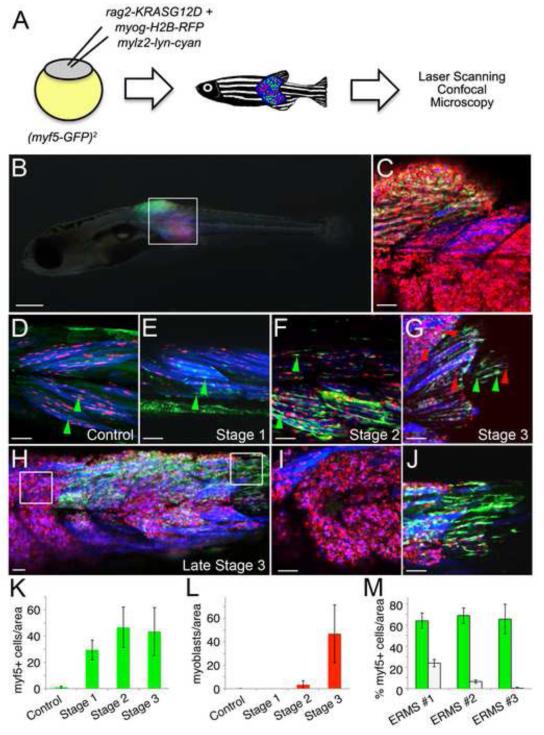
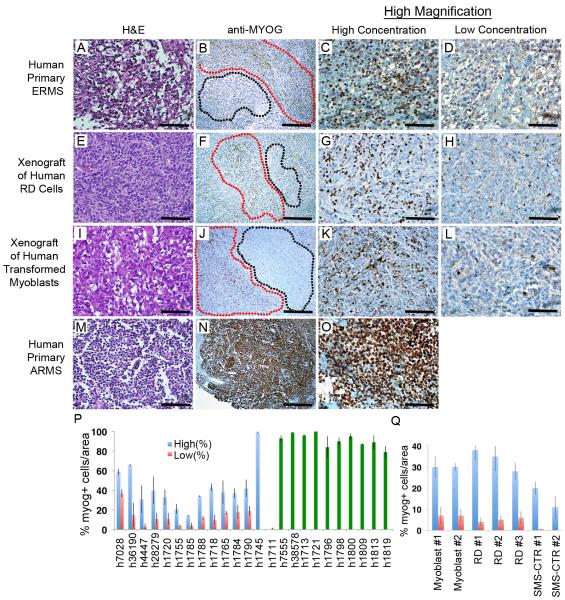
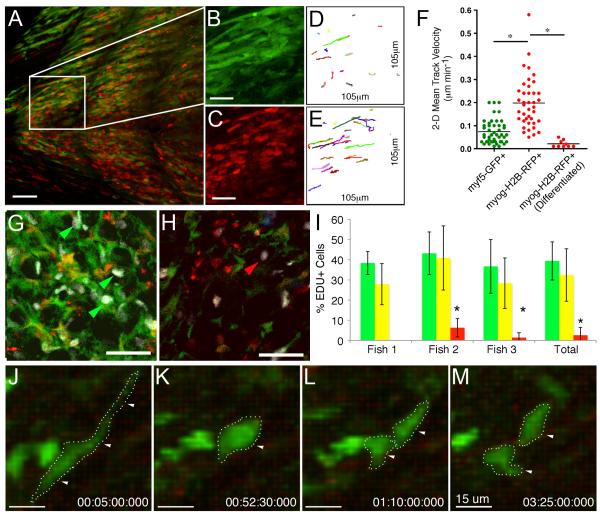
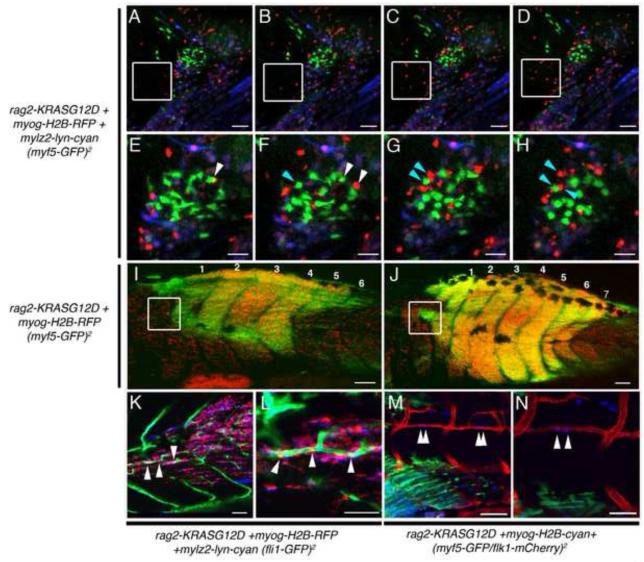
Embryonal rhabdomyosarcoma (ERMS) is an aggressive pediatric sarcoma of muscle. Here, we show that ERMS-propagating potential is confined to myf5+ cells and can be visualized in live, fluorescent transgenic zebrafish. During early tumor growth, myf5+ ERMS cells reside adjacent normal muscle fibers. By late-stage ERMS, myf5+ cells are reorganized into distinct regions separated from differentiated tumor cells. Time-lapse imaging of late-stage ERMS revealed that myf5+ cells populate newly formed tumor only after seeding by highly migratory myogenin+ ERMS cells. Moreover, myogenin+ ERMS cells can enter the vasculature, whereas myf5+ ERMS-propagating cells do not. Our data suggest that non-tumor-propagating cells likely have important supportive roles in cancer progression and facilitate metastasis.


Figures

Figure 1
Figure 1. Visualizing distinct stages of embryonal rhabdomyosarcoma growth
(A-F) rag2-dsRED-labeled ERMS arising in alpha-actin-GFP transgenic zebrafish. (A-C) The same animal imaged at 6, 9, and 12 days post-fertilization (dpf). (D-F) A representative zebrafish where dsRED+ ERMS cells have already bypassed the horizontal myoseptum and migrated into new segments that were previously free of tumor (F, stage 3) at 13, 18, and 24 dpf (D-F, respectively). The horizontal myoseptum is denoted by white arrows in A-F. (G) fli1-GFP transgenic control animal compared with a rag2-dsRED-labeled ERMS arising in fli1-GFP transgenic zebrafish at early stage 2 (H) or a late stage 3 (I). (J-M) Schematic of stages of ERMS growth. Scale bar A-C upper panel 500 μm, A-C lower panel and D-I 100 μm. See also Movie S1.
Figure 2
Figure 2. Fluorescent transgenic approaches identify discrete and molecularly definable ERMS cell subpopulations in myf5-GFP/mylz2-mCherry transgenic fish
(A) Heat map showing differential gene expression between FACS sorted ERMS cell subpopulations isolated from serially-passaged myf5-GFP/ mylz2-mCherry ERMS (microarray log fold-change >1.5). myf5-GFP+/mylz2-mCherry-negative (G+), myf5-GFP+/mylz2-mCherry+ (G+R+), myf5-GFP-negative/mylz2-mCherry+ (R+), and double negative (DN). (B) Quantitative real-time PCR of sorted ERMS cell subpopulations. Expression values +/− 1 STD. (C-D) Confocal images of EDU stained sections from serially passaged myf5-GFP+/mylz2-mCherry+ ERMS. Tumor regions with large numbers of either myf5-GFP+ (C) or mylz2-mCherry+ ERMS cells (D). Blue denotes DAPI+ nuclei and white labels EDU+ nuclei. Yellow arrows indicate EDU-labeled cells. Scale bar is 25 μm. (E) Quantification of EDU-incorporation over a 6 hour EDU pulse. Data for myf5-GFP+/mylz2-mCherry-negative ERMS cells denoted by green bars, myf5-GFP+/mylz2-mCherry+ by yellow, and myf5-GFP-negative/mylz2-mCherry+ cells by red. Three individual tumors shown as well as cumulative data across all tumors (Total). Asterisk denotes p<0.00001 and error bars +/−1 STD. (F) FACS plot of serially passaged myf5-GFP/mylz2-mCherry ERMS. (G-J) Gated ERMS cells assessed for DAPI and AnnexinV-APC staining (double negative (DN), G; myf5-GFP+/mylz2-mCherry-negative (G+), H; myf5-GFP+/mylz2-mCherry+ (G+R+), I; myf5-GFP-negative/mylz2-mCherry+ (R+), J). Live cells are shown the DAPI-negative/AnnexinV-negative gates. See also Figure S1 and Table S1.
Figure 3
Figure 3. ERMS-propagating cells express myf5-GFP but not the mylz2-mCherry differentiated muscle marker
(A) Schematic of experimental design. (B-D) A primary ERMS arising in syngeneic myf5-GFP/mylz2-mCherry transgenic zebrafish (35 dpf). Broken black line denotes tumor area. (E-G) Fluorescent-labeled ERMS engraft into syngeneic secondary recipient animals when transplanted with unsorted primary ERMS cells. (H-K) FACS plots of fluorescent-labeled ERMS cells isolated from secondary recipient fish following two rounds of FACS. (L-R) Transplantation of myf5-GFP+/mylz2-mCherry-negative FACs sorted cells induced ERMS in tertiary transplant animals and (S-U) quaternary recipients. Hematoxylin and eosin stained sections (C,F,M,T) and FACS (D,G,N,U) of primary and serially passaged ERMS. Scale bars equal 2 mm (B, E, L and S) and 100 μm (C, F, M and T).
Figure 4
Figure 4. myf5-GFP+ ERMS-propagating cells are dynamically reorganized during tumor growth
(A) Schematic of the experimental design. (B) A myf5-GFP transgenic animal injected at the one-cell stage of life with rag2-KRASG12D, myogenin-H2B-RFP, and mylz2-lyn-cyan with triple fluorescent-labeled ERMS at 16 days of life. (C) A merged confocal image of the boxed region shown in B. (D) Control myf5-GFP transgenic animal injected with myogenin-H2B-RFP and mylz2-lyn-cyan. myf5-GFP+ muscle precursor cells are denoted by green arrowheads. (E-G) Representative image of an ERMS-affected zebrafish labeled with myf5-GFP, myogenin-H2B-RFP and mylz2-lyn-cyan at stage 1, 2 and 3, respectively. Green arrowheads denote myf5-GFP+ cells whereas red arrowheads denote mononuclear myogenin-H2B-RFP+ ERMS cells. (H) Late stage 3 ERMS from a triple fluorescent-labeled animal. (I-J) Boxed regions in H imaged at higher magnification show regional partitioning of differentiated cells (I) compared with myf5-GFP+ ERMS-propagating cells (J). (K) Quantification of myf5-GFP+ cells during stages of ERMS growth when compared to control animals. (L) Quantification of mononuclear myogenin-H2B-RFP+ cells during stages of ERMS growth when compared to control animals. (M) Quantification of regional compartmentalization of ERMS cells based on differentiation status in late stage 3 tumors (n=3). Green bars denote regions that contain higher percentages of myf5-GFP+ ERMS-propagating cells compared to white bars where myf5-GFP+ cells are less abundant and conversely more differentiated. Error bars in K-M +/− 1 STD. Scale bar is 500 μm (B) and 50 μm (C-J). See also Figure S2.
Figure 5
Figure 5. Human embryonal rhabdomyosarcoma exhibit regional portioning of cells based on myogenic factor expression
(A-D) Primary human ERMS. (E-H) RD human cell lines or (I-L) human RAS-transformed myoblasts introduced into SCID/beige mice. (M-O) Primary human ARMS. Hematoxylin/Eosin stained sections (A, E, I, M) and anti-myogenin immunohistochemistry performed on adjacent sections (B, F, J, N). Regions containing high numbers of myogenin+ cells are denoted by red outline while regions with low numbers of myogenin+ cells are denoted by black outline (B, F, J). ARMS did not show regional portioning based on myogenin staining (N). Magnified views of areas with high concentrations of Myogenin+ cells (C, G, K, O) or areas with low or absent expression (D, H, L). (P-Q) Quantification of regional compartments in primary and metastatic human RMS (P) and in mice xenografted with human RD and SMS-CTR ERMS cells and human RAS-transformed myoblasts (myoblasts, Q). Numbers in panel Q denote tumors arising in separate animals. Blue bars denote areas with high percentages of Myogenin+ cells compared to areas with low numbers of cells (red). Green bars denote diffuse and ubiquitous expression of Myogenin within ARMS. Error bars +/− 1 STD. Scale bars are 50 μm (A, C, D, E, G, H, I, K, L, M, O) and 200 μm (B, F, J, N) See also Figure S3 and Table S2.
Figure 6
Figure 6. myf5-GFP+ ERMS-propagating cells are slow moving but highly proliferative while myogenin-H2B-RFP+ cells do not divide but are highly migratory
(A-E) Multiphoton recording of a stage 3 ERMS arising in myf5-GFP/myogenin-H2B-RFP transgenic zebrafish (B, C) Magnified view of the boxed region in panel A showing myf5-GFP+ (B) or myogenin-H2B-RFP+ ERMS cells (C). (D, E) Tracks of cell movement over the 6.7h observation period. The same areas are shown as in panels B and C, respectively. (F) Mean track velocities of representative cell types contained within the tumor mass. Asterisk denotes p < 0.001. (G-H) EDU staining of double transgenic myf5-GFP+/myogenin-H2B-RFP+ primary zebrafish ERMS (35 dpf). Confocal image of a tumor section with high numbers of myf5-GFP+ ERMS cells (G) compared to a section with high numbers of myogenin-H2B-RFP+ cells (H). White denotes nuclei that have incorporated EDU. EDU incorporation into myf5-GFP+ or myogenin-H2B-RFP+ ERMS cells denoted by green or red arrows, respectively. (I) Quantification of proliferation over the 6 hour EDU pulse. myf5-GFP+/myogenin-H2B-RFP-negative (green bars), double positive (yellow bars), and myf5-GFP-negative/myogenin-H2B-RFP+ (red bars). Error bars +/−1 STD. Asterisk denotes significant differences with p=0.0001. (J-M) Static images of a myf5-GFP+ ERMS cells dividing. Scales bar is 50 μm (A, G, H), 25 μm (B, C, D and E), and 15 μm (J-M). See also Figure S4 and Movie S2-6.
Figure 7
Figure 7. myf5-GFP+ ERMS-propagating cells are recruited to new areas of tumor growth only after seeding by myogenin+ ERMS cells
(A-H) Time-lapse images of myf5-GFP transgenic animal injected with rag2-KRASG12D, myogenin-H2B-RFP and mylz2-lyn-cyan. Panels are merged image planes taken every hour. myogenin-H2B-RFP+ cells migrate into normal tissues over time (white boxed region). Magnified views of time-lapse images documenting that myf5-GFP+ cells are largely stationary while myogenin-H2B-RFP+ cells are highly migratory and migrate away from GFP+ cells (denoted by arrows in E-H). (I, J) Serial imaging of a myf5-GFP transgenic animal injected with rag2-KRASG12D and myogenin-H2B-RFP shown at 14 and 17 dpf, respectively. White boxes demark a region that initially contained only myogenin-H2B-RFP+ cells (I) but was later colonized by myf5-GFP+ cells (J). (K-L) ERMS developing in a fli1-GFP transgenic animal injected with rag2-KRASG12D, myogenin-H2B-RFP, and mylz2-lyn-cyan. (K) Merged z-stacks showing three myogenin-H2B-RFP+ cells associated with and inside fli1-GFP+ vessels, which was confirmed by imaging a single image plane at higher magnification (L, white arrow head). (M-N) ERMS developing in a flk1-mCherry transgenic animal injected with rag2-KRASG12D and myogenin-H2B-cyan showing four cells entering the vasculature (White arrowheads, M) and a single plane image showing two cells transiting into the vasculature at higher magnification (White arrowheads, N). Scale bar is 50 μm (A-H, K, L, N) and 100 μm (I, J, M). See also Figure S4 and Movie S7-9.

References

    1. Bentzinger CF, Wang YX, Rudnicki MA. Building muscle: molecular regulation of myogenesis. Cold Spring Harb Perspect Biol. 2012;4 - PMC - PubMed
    1. Chen YH, Wang YH, Chang MY, Lin CY, Weng CW, Westerfield M, Tsai HJ. Multiple upstream modules regulate zebrafish myf5 expression. BMC Dev Biol. 2007;7:1. - PMC - PubMed
    1. Conboy IM, Conboy MJ, Smythe GM, Rando TA. Notch-mediated restoration of regenerative potential to aged muscle. Science. 2003;302:1575–1577. - PubMed
    1. Cooper RN, Tajbakhsh S, Mouly V, Cossu G, Buckingham M, Butler-Browne GS. In vivo satellite cell activation via Myf5 and MyoD in regenerating mouse skeletal muscle. J Cell Sci. 1999;112(Pt 17):2895–2901. - PubMed
    1. Dalerba P, Cho RW, Clarke MF. Cancer stem cells: models and concepts. Annu Rev Med. 2007;58:267–284. - PubMed

Publication types

MeSH terms

Associated data