. 2012 Jul;85(1):21-38.
doi: 10.1111/j.1365-2958.2012.08081.x. Epub 2012 May 24.

Superresolution imaging of ribosomes and RNA polymerase in live Escherichia coli cells

Affiliations

Superresolution imaging of ribosomes and RNA polymerase in live Escherichia coli cells

Somenath Bakshi et al. Mol Microbiol. 2012 Jul.

Abstract

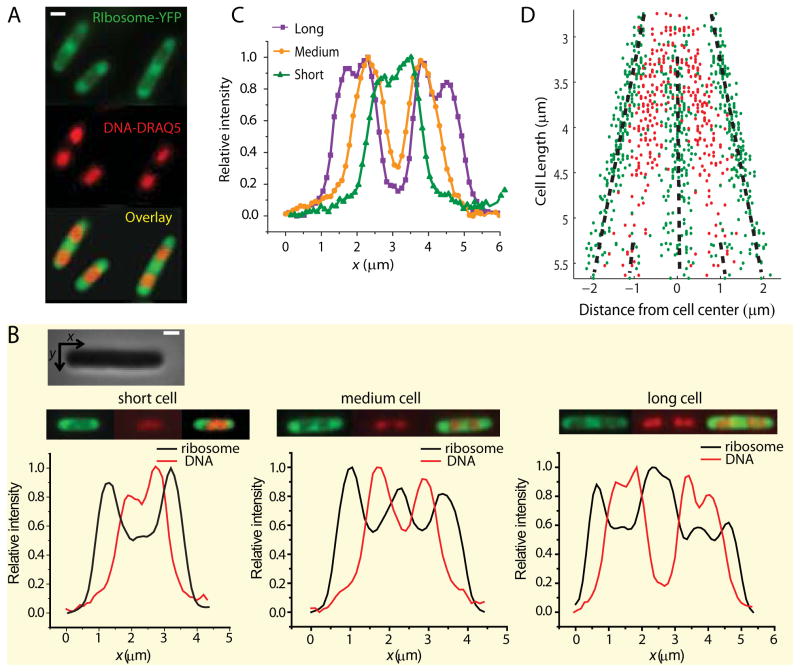
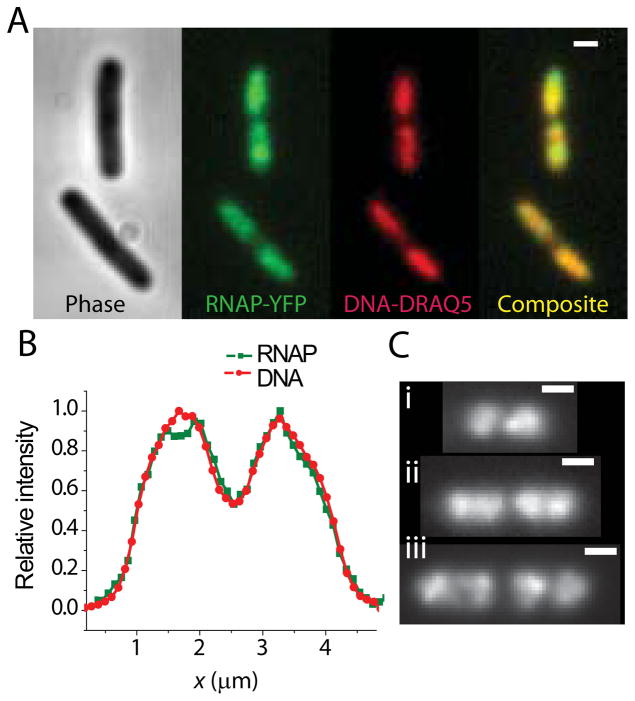
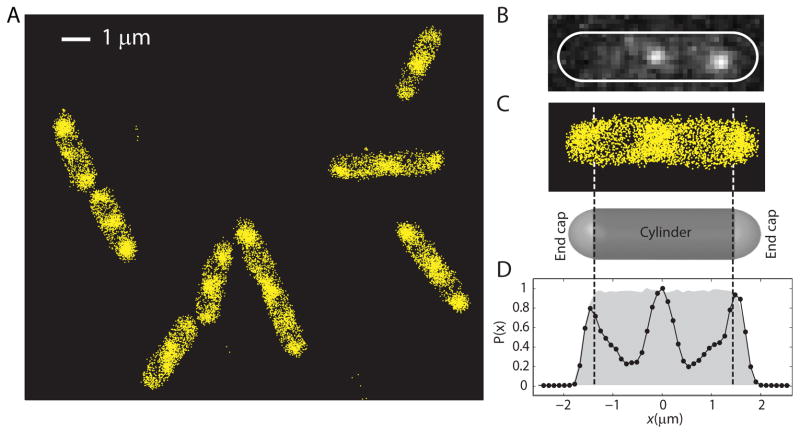
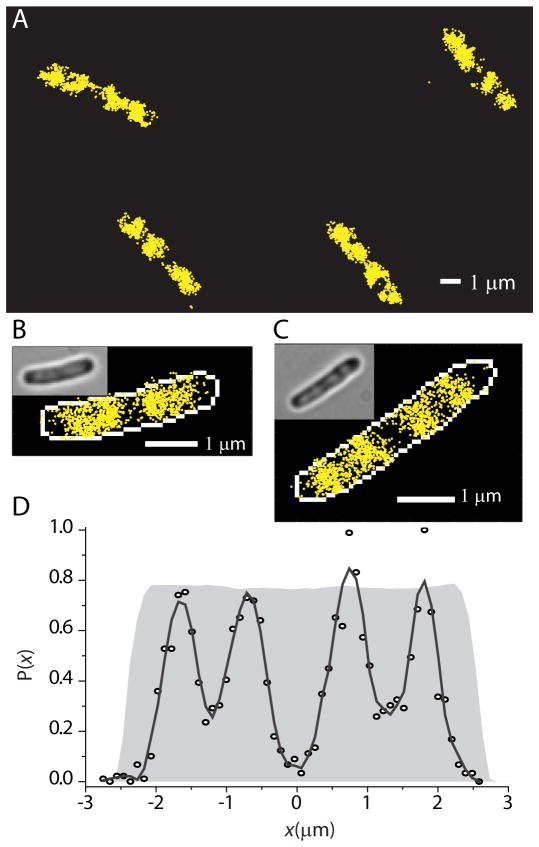
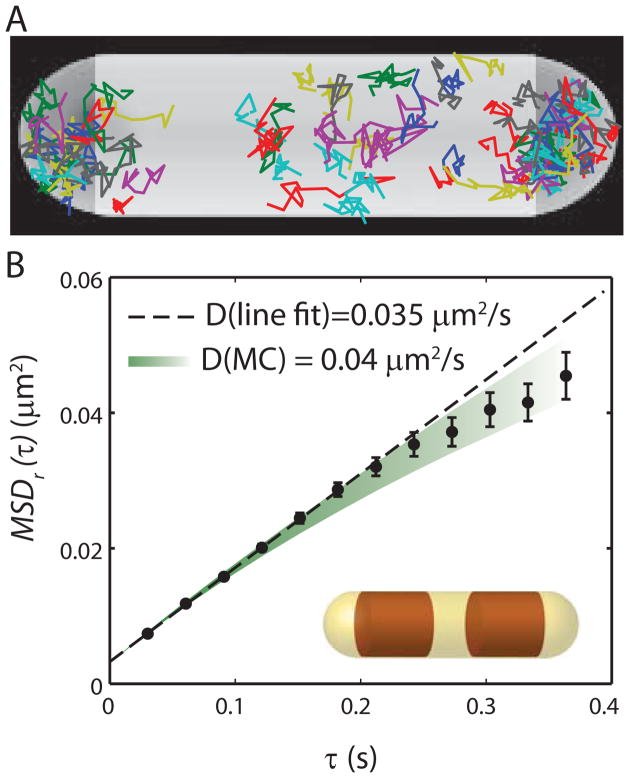
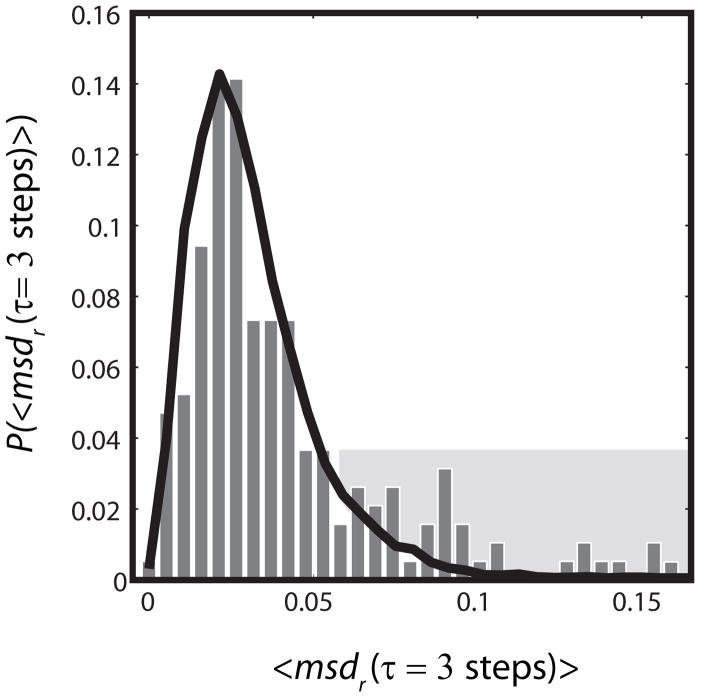
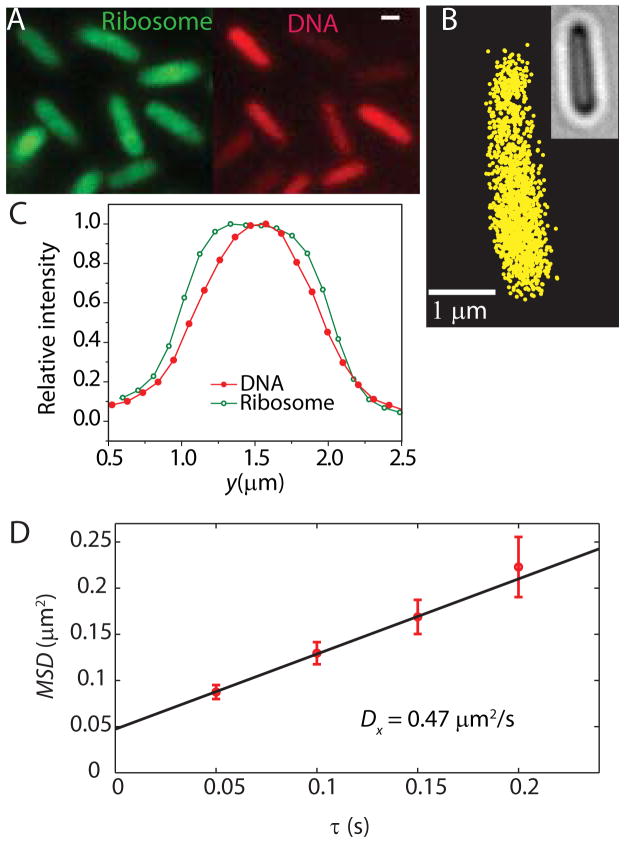
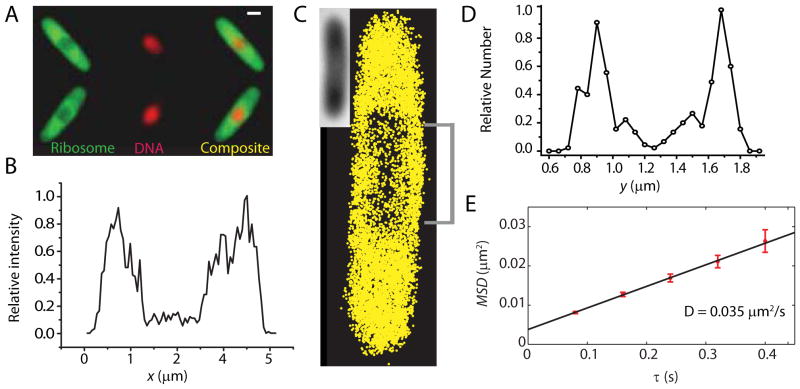
Quantitative spatial distributions of ribosomes (S2-YFP) and RNA polymerase (RNAP; β'-yGFP) in live Escherichia coli are measured by superresolution fluorescence microscopy. In moderate growth conditions, nucleoid-ribosome segregation is strong, and RNAP localizes to the nucleoid lobes. The mean copy numbers per cell are 4600 RNAPs and 55,000 ribosomes. Only 10-15% of the ribosomes lie within the densest part of the nucleoid lobes, and at most 4% of the RNAPs lie in the two ribosome-rich endcaps. The predominant observed diffusion coefficient of ribosomes is D(ribo) = 0.04 µm(2) s(-1), attributed to free mRNA being translated by one or more 70S ribosomes. We find no clear evidence of subdiffusion, as would arise from tethering of ribosomes to the DNA. The degree of DNA-ribosome segregation strongly suggests that in E. coli most translation occurs on free mRNA transcripts that have diffused into the ribosome-rich regions. Both RNAP and ribosome radial distributions extend to the cytoplasmic membrane, consistent with the transertion hypothesis. However, few if any RNAP copies lie near the membrane of the endcaps. This suggests that if transertion occurs, it exerts a direct radially expanding force on the nucleoid, but not a direct axially expanding force.


Figures

Figure 1
Figure 1
Widefield imaging of ribosomes (S2-YFP labels) and chromosomal DNA (DRAQ5 stain) for K-12 cells grown in EZRDM at 30°C. (A) Ribosome distribution (green) and DNA distribution (red) for three typical cells. The composite image shows the anti-correlation between the two distributions. (B) Axial intensity distributions in the ribosome and DNA channels for a short, medium, and long cell. Intensity is summed along y (short axis coordinate) at each x (long axis coordinate). The two channels are strongly anti-correlated. (Inset: Phase contrast image of a cell showing x (along the long axis) and y (along short axis) coordinates.) (C) DNA axial intensity distribution for a short, medium, and long cell plotted on same axes to show progressive segregation as the cell elongates. (D) The distance from the cell center of the local maxima in ribosome distribution (green dots) and DNA distribution (red dots) plotted for 286 cells of different cell length. The black dashed lines guide the eye. Scale bar = 1 μm.
Figure 2
Figure 2
Widefield imaging of RNA polymerase (β′-yGFP labels) and chromosomal DNA (DRAQ5 stain) for K-12 cells grown in EZRDM at 30°C. (A) Phase contrast image, RNAP image, and DNA image are shown for two different cells. The composite image shows RNAP co-localizes with DNA. Scale bar is 1 μm. (B) Axial intensity profile for RNAP-yGFP and DRAQ5-labeled DNA compared from a single cell. (C) RNAP images from three cells of length (i) 2.6 μm, (ii) 3.9 μm, and (iii) 5.1 μm. Scale bar is 1 μm. Progressive segregation of RNAP distribution is similar to DNA segregation shown in Fig. 1.
Figure 3
Figure 3
Superresolution images of ribosomes (S2-YFP) within K-12 cells grown in EZRDM at 30°C. Each localization is plotted as a point at the calculated centroid position. (A) Nine representative cells. (B) Image of two single molecules within a cell prior to image filtering. Cell outline based on phase contrast image. (C) Expanded view of superresolution image of ribosomes in the same cell. A model spherocylinder is shown as a guide to the endcap positions. (D) Relative number of ribosomes at each axial position, with data along y at each x summed into 100 nm bins. The grey background shows the theoretical profile for a uniform distribution filling the model spherocylinder, taking account of measurement uncertainty and binning. Sectioning by the 1.49 NA objective does not affect the axial distribution significantly, as shown in Supporting Information (Fig. S3).
Figure 4
Figure 4
Superresolution images of RNA polymerase (β′-yGFP) within K-12 cells grown in EZRDM at 30°C. (A) Four representative cells. (B) Expanded view of a medium-length cell (tip-to-tip length = 3.9 μm). (C) Expanded view of a long cell (tip-to-tip length = 5.2 μm). (D) Relative number of RNAP copies at each axial position x (100 nm bins). Solid line is the result of a Savitzky-Golay smoothing filter. The grey background shows the theoretical profile for a uniform distribution filling the model spherocylinder, as in Fig. 3. Note that RNAP avoids the endcaps.
Figure 5
Figure 5
Ribosome diffusion in untreated cells. (A) Trajectories of single ribosomes (S2-YFP labels) within one cell, plotted within a spherocylinder chosen to match the phase contrast image. (B) Mean-square displacement vs lag time, averaged over 53 single-molecule trajectories from the same cell, each consisting of 13 steps. Error estimates are ±1σof the MSD values from single molecules. Dashed line is a linear fit to first three data points, yielding a diffusion coefficient estimate of D = 0.035 μm2-s−1. Colored swath represents the range of theoretical MSDr(τ) plots (± one standard deviation of the mean) obtained from averaging fifty 13-step Monte Carlo simulated trajectories using D = 0.04 μm2-s−1, the best-fit value as judged by eye. The simulations were run in a spherocylinder within which two truncated cylinders (representing the segregated DNA nucleoid lobes) block ribosome diffusion, as shown in the inset.
Figure 6
Figure 6
Heterogeneity of ribosome diffusion. Experimental distribution (bars) of best-estimate single-ribosome diffusion coefficients calculated from the three-step mean-square displacement. Each trajectory of ten steps or longer in a single cell is truncated at 10 steps. For each single-molecule j, msdr,j at lag time τ= 3 steps = 30 ms is calculatedas a running average over all 10 steps. The single-molecule msd is estimated as: msdr,j = <r2(τ=3 steps)>j/4τ. The black line represents the distribution from a simulation with 10,000 trajectories of length 10 step, using a homogeneous diffusion coefficient of 0.04 μm2/s and normalized to match experiment. The geometric model includes two impenetrable cylinders to represent nucleoid lobes, as shown in Fig. 5. The peak and the shaded tail of the experimental distribution are not well fit by the model. See Fig. S8 for a two-component fit to composite data from three cells.
Figure 7
Figure 7
Effects of treatment with rifampicin. See text for details. (A) Widefield ribosome (S2-YFP) and DNA (DRAQ5) spatial distributions 30 min after rifampicin addition. Scale bar =1 μm. (B) Super-resolution image of ribosome distribution. See Fig. 3 for comparison with untreated cells. (C) Widefield intensity distributions for ribosomes and DNA along the short cell axis y. (D) MSDx(τ) plot for single-ribosome diffusion in one cell after rifampicin treatment. Linear fit yields the estimate D = 0.47 μm2-s−1.
Figure 8
Figure 8
Effects of treatment with chloramphenicol. (A) Widefield ribosome (S2-YFP) and DNA (DRAQ5) spatial distributions 30 min after addition of chloramphenicol. Scale bar = 1 μm. (B) Axial ribosome profile from the super-resolution image shown in (C). Only the central 400 nm are included in the plot. (C) Superresolution image of ribosomes, 40 min after chloramphenicol treatment. (Inset = white light image of the cell). (D) Ribosome distribution along y, averaged over the 1 μm swath through the cell center as shown in (C). (E) MSDr(τ) plot from single-particle tracking of ribosomes 40 minutes after chloramphenicol treatment. Linear fit yields the estimate D = 0.035 μm2-s−1.

Comment in

References

    1. Ando T, Skolnick J. Crowding and hydrodynamic interactions likely dominate in vivo macromolecular motion. Proc Natl Acad Sci U S A. 2010;107:18457–18462. - PMC - PubMed
    1. Azam TA, Hiraga S, Ishihama A. Two types of localization of the DNA-binding proteins within the Escherichia coli nucleoid. Genes Cells. 2000;5:613–626. - PubMed
    1. Bakshi S, Bratton BP, Weisshaar JC. Subdiffraction-Limit Study of Kaede Diffusion and Spatial Distribution in Live Escherichia coli. Biophys J. 2011;101:2535–2544. - PMC - PubMed
    1. Batchelor E, Goulian M. Imaging OmpR localization in Escherichia coli. Molecular Microbiology. 2006;59:1767–1778. - PubMed
    1. Bernstein JA, Khodursky AB, Lin PH, Lin-Chao S, Cohen SN. Global analysis of mRNA decay and abundance in Escherichia coli at single-gene resolution using two-color fluorescent DNA microarrays. Proc Natl Acad Sci U S A. 2002;99:9697–9702. - PMC - PubMed

Publication types

MeSH terms