. 2012 Aug 31;382(1-2):117-28.
doi: 10.1016/j.jim.2012.05.011. Epub 2012 May 22.

Optimization and qualification of a multiplex bead array to assess cytokine and chemokine production by vaccine-specific cells

Affiliations

Optimization and qualification of a multiplex bead array to assess cytokine and chemokine production by vaccine-specific cells

Olivier D Defawe et al. J Immunol Methods. .

Abstract

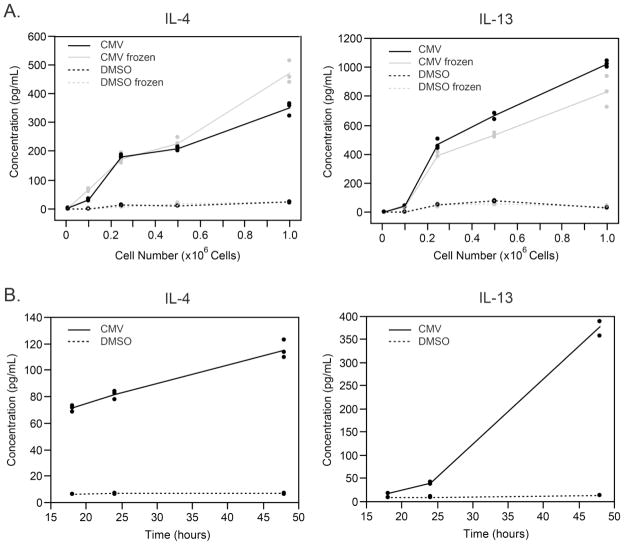
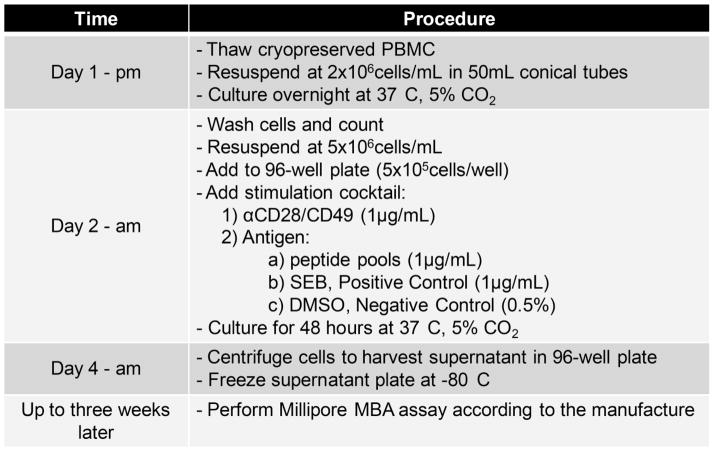
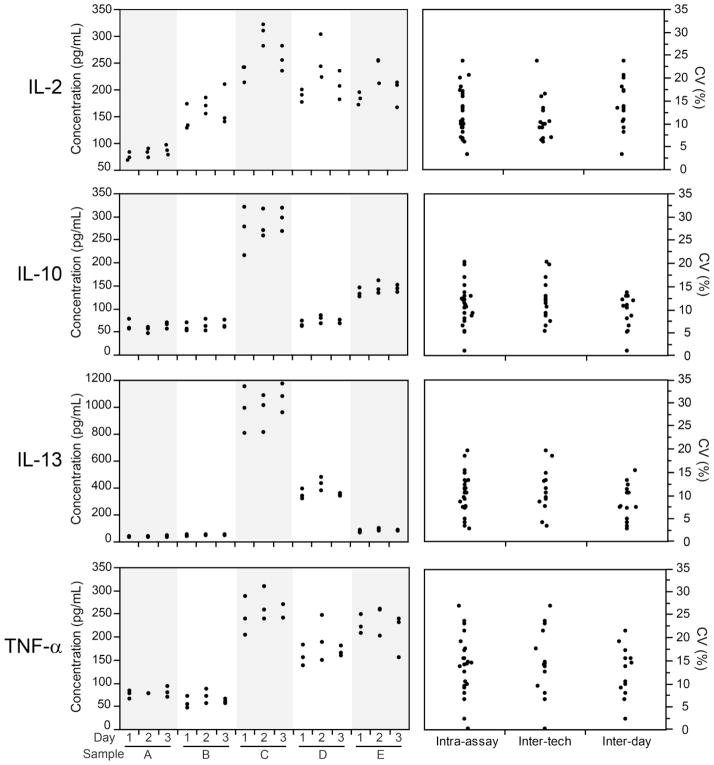
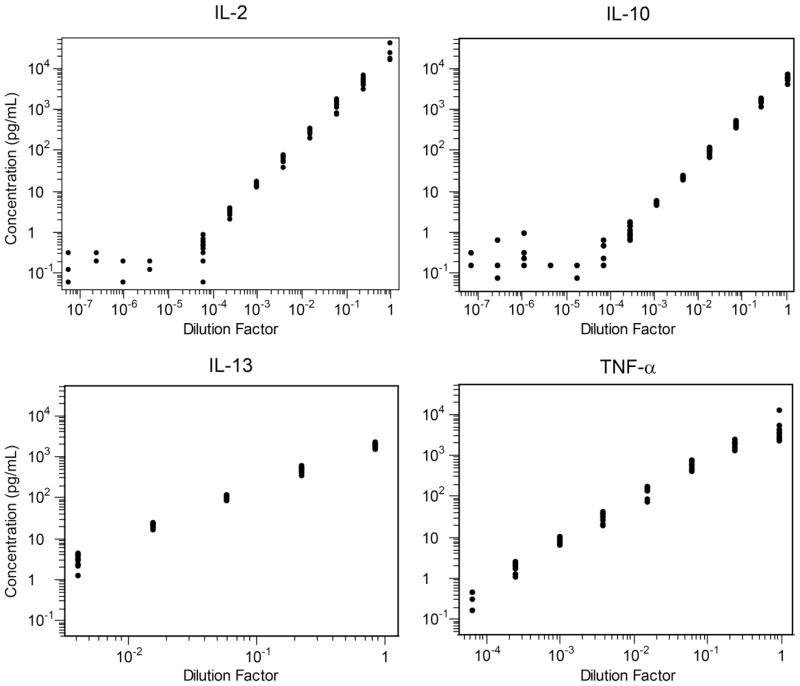
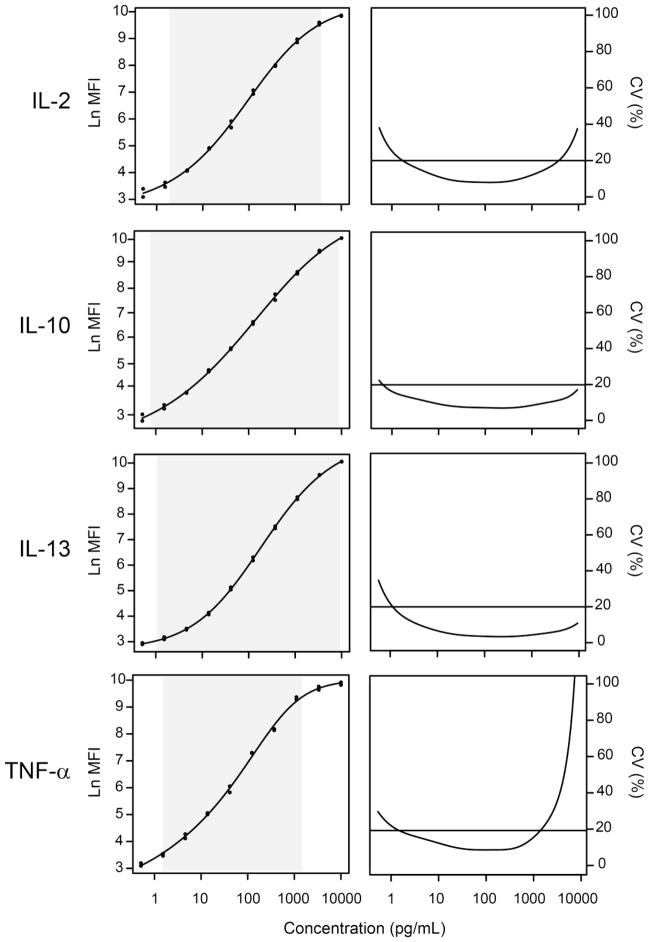
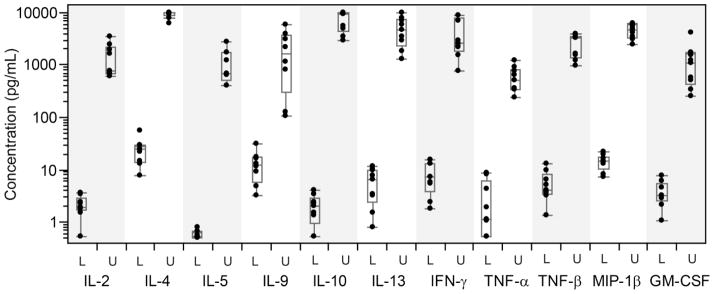
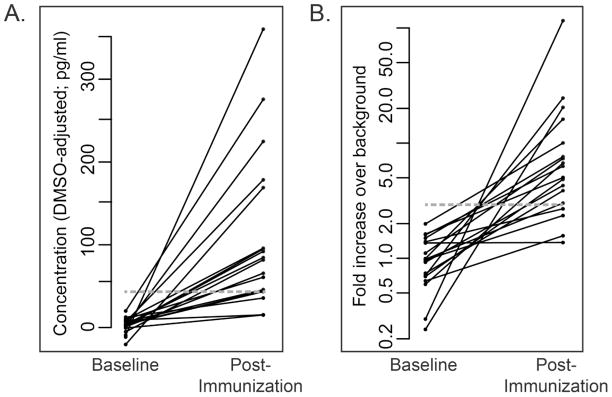
The magnitude and functional phenotype (e.g. proliferation, immune stimulation) of vaccine-induced T-cell responses are likely to be critical in defining responses that can control pathogenic challenge. Current multi-parameter flow cytometric techniques may not be sufficient to measure all of these different functions, since characterizing T-cell responses by flow cytometry is presently limited to concurrent measurement of at most 10 cytokines/chemokines. Here, we describe extensive studies conducted using standardized GCLP procedures to optimize and qualitatively/quantitatively qualify a multiplex bead array (MBA) performed on supernatant collected from stimulated peripheral blood mononuclear cells (PBMC) to assess 12 cytokines and chemokines of interest. Our optimized MBA shows good precision (intra-assay, inter-day, inter-technician; coefficients of variation <30%) and linearity for most of the analytes studied. We also developed positivity criteria that allow us to define a response as positive or negative with a high degree of confidence. In conclusion, we provide a detailed description of the qualification of an MBA, which permits quantitative and qualitative evaluation of vaccine-induced immunogenicity and analysis of immune correlates of protection. This assay provides an excellent complement to the existing repertoire of assays for assessing immunogenicity in HIV vaccine clinical trials.


Figures

Figure 1
Figure 1. Optimization of the multiplex bead array (MBA)
A) Concentration of IL-4 and IL-13 in supernatant as a function of the number of PBMC stimulated with CMV peptides (solid lines) or DMSO (peptide diluent that served as the negative control, dotted lines). The effect of freezing the supernatant before running by multiplex bead assay was also investigated (frozen supernatant, gray lines; non-frozen supernatant, black lines). B) Concentration of IL-4 and IL-13 in supernatant as a function of stimulation duration (CMV, solid lines; DMSO, dotted lines). The other analytes showed similar trends.
Figure 2
Figure 2. Flow chart of the MBA
This diagram outlines the major steps in the protocol used for analysis of PBMC samples. After day 4 supernatant samples can be frozen at −80°C for up to three weeks before proceeding to the remaining steps.
Figure 3
Figure 3. Intra-assay, inter-operator and inter-day variability
Left graphs: IL-2, IL-10, IL-13 and TNF-α concentrations were measured by one technician in supernatants collected from CMV-stimulated PBMC from five donors (A–E) on three days (plated in triplicate). Right graphs: For each analyte, the coefficient of variation (CV) is summarized for each category of variability for all precision experiments. To determine inter-operator variability, three technicians measured analyte concentrations of the same samples on the same day. To determine inter-day variability, one technician examined analyte concentrations of the same supernatant samples on three days. Intra-assay refers to variability of the replicates.
Figure 4
Figure 4. Linearity of the MBA
To assess linearity, supernatant collected from SEB-stimulated PBMC was serially diluted four-fold twelve times. IL-2, IL-10, IL-13 and TNF-α concentrations were measured in twelve replicates at each dilution level. The shaded area corresponds to the LLOQ – ULOQ range. Linearity was only assessed for data within this range. Note that many replicates with concentrations lower than the LLOQ were not measurable and are not shown.
Figure 5
Figure 5. Determination of lower and upper limit of quantitation
Lower and upper limit of quantitation (LOQ) for IL-2, IL-10, IL-13 and TNF-α are estimated from the standard curves. Left: Examples of plots of the ln(MFI) values measured form the standard samples versus the expected concentration. The shaded area corresponds to the LLOQ – ULOQ range, as determined by the precision profile. Right: Precision profile, which is a plot of the percent CV, defined as the ratio of the estimated standard error over the estimated concentration, versus the estimated concentration. Starting at the lowest concentration, the LLOQ is defined to be the point at which this ratio dips below 20%, while the ULOQ is defined to be the point at which this ratio again rises above 20%. Similar curves were calculated for all analytes.
Figure 6
Figure 6. Range of LLOQ and ULOQ measurements for each analyte as calculated in nine qualification experiments
Boxes denote the median and interquartile ranges (IQR); whiskers extend to the furthest point within 1.5 times the IQR from the upper or lower quartile. IL-3 is omitted because its LOQ could only be calculated twice. Lower and upper limits are designated as “L” and “U”.
Figure 7
Figure 7. Positivity criteria for IL-2
A. The minimum analyte concentration to be considered positive was determined by assessing the background-subtracted IL-2 concentration measured in supernatant samples from Env-stimulated PBMC collected from vaccine participants before (Baseline) and after vaccination (Post-Immunization). Based on these measurements, a minimum analyte concentration threshold at 40pg/mL was selected for IL-2 (gray line). B. Fold over background IL-2 concentration measured in samples from Env-stimulated PBMC collected from vaccine participants before (Baseline) and after vaccination (Post-Immunization). A minimum 3-fold increase over background concentration was selected (gray line). Similar criteria were determined for all analytes.

References

    1. Bull M, Lee D, Stucky J, Chiu YL, Rubin A, Horton H, McElrath MJ. Defining blood processing parameters for optimal detection of cryopreserved antigen-specific responses for HIV vaccine trials. J Immunol Methods. 2007;322:57–69. - PMC - PubMed
    1. Busse D, de la Rosa M, Hobiger K, Thurley K, Flossdorf M, Scheffold A, Hofer T. Competing feedback loops shape IL-2 signaling between helper and regulatory T lymphocytes in cellular microenvironments. Proc Natl Acad Sci U S A. 2010;107:3058–63. - PMC - PubMed
    1. De Rosa SC, Thomas EP, Bui J, Huang Y, deCamp A, Morgan C, Kalams SA, Tomaras GD, Akondy R, Ahmed R, Lau CY, Graham BS, Nabel GJ, McElrath MJ. HIV-DNA priming alters T cell responses to HIV-adenovirus vaccine even when responses to DNA are undetectable. J Immunol. 2011;187:3391–401. - PMC - PubMed
    1. De Rosa SC, Thomas EP, Bui J, Huang Y, deCamp A, Morgan C, Kalams SA, Tomaras GD, Akondy R, Ahmed R, Lau CY, Graham BS, Nabel GJ, McElrath MJ. HIV-DNA priming alters T cell responses to HIV-adenovirus vaccine even when responses to DNA are undetectable. J Immunol. 2012;187:3391–401. - PMC - PubMed
    1. Djoba Siawaya JF, Roberts T, Babb C, Black G, Golakai HJ, Stanley K, Bapela NB, Hoal E, Parida S, van Helden P, Walzl G. An evaluation of commercial fluorescent bead-based luminex cytokine assays. PLoS One. 2008;3:e2535. - PMC - PubMed

Publication types

LinkOut - more resources