. 2012 Dec 15;520(18):4254-74.
doi: 10.1002/cne.23154.

Intrinsic signal optical imaging evidence for dorsal V3 in the prosimian galago (Otolemur garnettii)

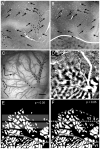
Affiliations

Intrinsic signal optical imaging evidence for dorsal V3 in the prosimian galago (Otolemur garnettii)

Reuben H Fan et al. J Comp Neurol. .

Abstract

Currently, we lack consensus regarding the organization along the anterior border of dorsomedial V2 in primates. Previous studies suggest that this region could be either the dorsomedial area, characterized by both an upper and a lower visual field representation, or the dorsal aspect of area V3, which only contains a lower visual field representation. We examined these proposals by using optical imaging of intrinsic signals to investigate this region in the prosimian galago (Otolemur garnettii). Galagos represent the prosimian radiation of surviving primates; cortical areas that bear strong resemblances across members of primates provide a strong argument for their early origin and conserved existence. Based on our mapping of horizontal and vertical meridian representations, visuotopy, and orientation preference, we find a clear lower field representation anterior to dorsal V2 but no evidence of any upper field representation. We also show statistical differences in orientation preference patches between V2 and V3. We additionally supplement our imaging results with electrode array data that reveal differences in the average spatial frequency preference, average temporal frequency preference, and sizes of the receptive fields between V1, V2, and V3. The lack of upper visual field representation along with the differences between the neighboring visual areas clearly distinguish the region anterior to dorsal V2 from earlier visual areas and argue against a DM that lies along the dorsomedial border of V2. We submit that the region of the cortex in question is the dorsal aspect of V3, thus strengthening the possibility that V3 is conserved among primates.


Figures

Figure 1
Figure 1
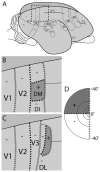
V3 versus DM. Two possible organizations of visual areas in galagos are depicted. A: Galago brain and depiction of some cortical areas. B: DM proposal: region anterior to V2 contains a full visual field representation that includes both lower and upper visual field. C: V3 proposal: region anterior to V2 is V3 and represents only ventral visual field. D: Depiction of the left visual field. DL, dorsolateral area; DI, dorsointermediate area; MT, middle temporal area; MST, middle superior temporal area; FST, fundus of superior temporal sulcus; MTc, MT crescent; A, auditory cortex; M, motor cortex; FS, frontal sulcus; LS, lateral sulcus; IPS, intraparietal sulcus. +, Upper visual field; − lower visual field; open circles, vertical meridian; filled squares, horizontal meridian.
Figure 2
Figure 2
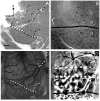
Alignment of histological tissue and optical images (case 08-61). We used CO-stained sections to identify the location of the V1/V2 border. A: A flattened superficial CO section revealing vasculature both perpendicular (holes) and parallel to the flattened surface. B: A deeper flattened section reveals the characteristic CO blobs of V1, which terminate at the V1/V2 border (solid line). The two sections (A and B) are aligned with the vessel patterns perpendicular to the imaging plane (arrows). C: To align CO stains and our optical images, an in vivo blood vessel pattern was acquired under green light (see Materials and Methods). The dashed lines delineate sample vessels used to align with surface vasculature in the CO section (dashed lines in A). D: Optical imaging overlying V1, V2, and V3 (field-of-view is shifted from that in C; see dotted lines). V1/V2 border is then overlaid on field-of-view. Dotted line, approximate V2/V3 border; dashed line, approximate anterior border of V3. A, anterior; M, medial. Scale bar = 1 mm in A (applies to A–D).
Figure 3
Figure 3
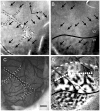
Alignment of histological tissue and optical images (case 08-11). This is another example of aligning a CO-defined V1/V2 border to an OIS map. The V1/V2 border defined by the CO blobs overlies region of orientation patch size change. We quantify this difference later (see Figs. 12 and 13). A: A superficial CO section containing surface vasculature. B: A deeper section revealing the characteristic CO blobs of V1, which terminate at the V1/V2 border (solid line). The two sections (A and B) are aligned with vessel patterns (arrows). C: An in vivo blood vessel pattern acquired under green light (see Materials and Methods). Dashed lines delineate sample vessels used to align with surface vasculature shown (dashed lines in A). D: Orientation map in V1, V2, and area anterior to V2. Dotted line, approximate V2/V3 border; dashed line, approximate anterior border of V3. A, anterior; M, medial. Scale bar = 1 mm in C (applies to A–D).
Figure 4
Figure 4
Lack of upper visual field representation anterior to V2 (case 08-61). Here we present two large rectangular stimuli that were 10° apart. In each we present square wave gratings (see text). The diagrams of stimuli are for illustration purposes only and are not to scale. One stimulus is found in the lower visual field (A) and another in the upper visual field (D). In contrast to lower visual field stimulation, we found no compelling evidence for upper visual field representation along the V2 border. A: Stimulus location confined to the lower visual field (26° in height), 0° and 90° are presented. B: The resulting 8-bit gray scale orientation preference map to A. C: We created a t-map (see Materials and Methods) for the orientation preference map shown in B (P < 0.05). D: Stimulus location confined to the upper visual field (24° in height) with the same stimulus parameters as in the lower visual field confined version (A). E: The resulting 8-bit gray scale orientation preference map to D. F: As we did for the lower visual field confined map, we created a t-map from orientation preference map shown in E (P < 0.05). Solid line, V1/V2 border; dotted line, anterior V2 border; dashed line, approximate anterior border of V3. These borders are estimated based on retinotopic mapping and orientation preference maps. A, anterior; M, medial. Scale bar = 2 mm in F (applies to B,C,E,F).
Figure 5
Figure 5
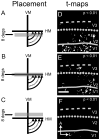
Retinotopic mapping with 20° bar stimuli (case 08-11). In general, we expect a medial to lateral movement as the bars move from more peripheral locations to more foveal locations. A–C: The relative stimulus (displaying 45° or 135° orientation gratings) locations for 20° height bars in the left column. D–F: The resulting t-maps (P < 0.01). As in Figure 4, the diagrams of stimulus position are purely for illustration purposes and are not to scale. Note that in C, the upper visual field stimulus shows very little activation. The pattern anterior to V2 in F overlaps with that in E, consistent with our interpretation that this is due to HM activation. Solid line, V1/V2 border, same as Figure 3; dotted line: approximate anterior V2 border based on HM mapping; dashed line, approximate anterior border of V3. A, anterior; M, medial. Scale bar = 2 mm in F (applies to D–F).
Figure 6
Figure 6
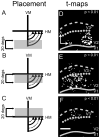
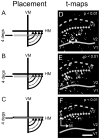
Retinotopic mapping with 8° bars (case 08-61). A–C: Three bars were presented here one located in the lower visual field (A), one located at the HM location (B), and one located in the upper visual field (C). As in previous figures, the diagrams are for illustration purposes only and are not to scale. Each stimulus (displaying 45° or 135° orientation gratings) was 8° in height. D–F: In the corresponding t-maps, we find activation in the lower visual field (D) and activation due to HM coverage (E) but no activation as a result of the upper visual field position (F) (P < 0.01 for all t-maps). This is consistent with the result presented in Figure 4. Solid line, V1/V2 border, same as Figure 2; dotted line, approximate anterior V2 border based on HM mapping. The estimated location of HM corresponds with that estimated in orientation map (see Fig. 11C,D). Dashed line, approximate anterior border of V3. A, anterior; M, medial. Scale bar = 2 mm in E (applies to D–F).
Figure 7
Figure 7
Retinotopic mapping with 4° bars (case 08-11). In this case, we use a 4° bar. A–C: As in Figures 5 and 6, we show the relative position of stimuli displaying 45° and 135° gratings presented in these three spatially restricted locations. D–F: The resulting t-maps (P < 0.01). Here we see the shift toward the V2/V3 border as the bar approaches HM. Solid line, V1/V2 border, same as Figure 3; dotted line, approximate anterior V2 border based on HM mapping; dashed line, approximate anterior border of V3. A, anterior; M, medial. Scale bar = 2 mm in F (applies to D–F).
Figure 8
Figure 8
HM mapping with 10° square windows (case 10-10). Here we used 10° square windowed stimuli along the HM. A1–E1: Illustration of the relative positions of the squares. The stimuli start at the area centralis and move in 5° increments into the periphery. Here we used single condition maps (see Materials and Methods) to visualize the cortical representation. A2–E2: The familiar 8-bit gray scale images. A3–E3: Corresponding t-maps (P < 0.01). See text for additional details. Solid line, V1/V2 border; dotted line, V2/V3 border based on this HM mapping; dashed line, presumptive anterior V3 border, estimated from VM mapping shown in Figure 9. A, anterior; L, lateral. Scale bar = 2 mm in E3 (applies to A2–E3).
Figure 9
Figure 9
VM mapping with 10° square windows (case 10-10). Again we used 10° square stimuli but along the VM. We began in the lower visual field and moved well into the upper visual field. A1–K1: Illustration of this progression. As in Figure 8, the squares moved in 5° increments. A2–K2: The corresponding single conditions 8-bit gray scale maps. A3–K3: The corresponding t-maps (P < 0.01). There are strong activation patterns from lower visual field activation (A–E columns) but not upper field activation (G–K columns). Dashed line, presumptive anterior V3 border, estimated from this mapping; dotted line, V2/V3 border based on HM mapping from Figure 8. A, anterior; L, lateral. Scale bar = 2 mm in K3 (applies to A2-K3).
Figure 10
Figure 10
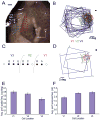
Electrode array recording data. A: CO-stained section of visual cortex after removal of the array. The V1/V2 border was determined by using CO staining to mark CO blobs in area V1. Red dots, V1 electrodes; green dots, V2 electrodes; blue dots, V3 electrodes. A, anterior; D, dorsal. B: Receptive fields of 56 V1, V2, and V3 neurons. The V2/V3 border was determined by dramatic change in receptive field sizes. Red, V1; green, V2; Blue, V3. C: Schematic of 10 pins and their relative locations in V1, V2, and V3. D: Receptive field locations on selected pins within a 10-pin row along the array. The greater receptive field size in V3 allows the three-pin progression in V3 to span nearly the entire arc from the VM to HM. E: Average spatial frequency preference of the 56 neurons from this case. F: Average temporal frequency preference of the 56 neurons from this case. Scale bar = 1 mm in A; 2° in B and D.
Figure 11
Figure 11
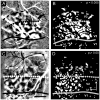
Orientation preference maps are not continuous along the anterior border of V2 (cases 08-11/08-61). We show two example cases with regions that lack signal to the orientation gratings. One possibility is that this exhibits banding of orientation-selective regions in V3 (see text for additional possibilities). A,B: Gray scale orientation maps and t-maps, respectively, from case 08-11 (0°–90°). C,D: Gray scale orientation maps and t-maps, respectively, from case 08-61 (0°–90°). In contrast to V3, area V2 lacks evidence of banding. In both cases, the locations of areal borders based on banding differences between areas agrees well with the defined borders histologically and retinotopic mapping using OIS. Solid line, V1/V2 border; dotted line, V2/V3 border; dashed line, estimated anterior V3 border. A, anterior; M, medial. Scale bar = 2 mm in A (applies to A,B) and C (applies to C,D).
Figure 12
Figure 12
Procedure for orientation preference patch size determination (case 08-49). In many of the orientation preference maps, it appeared that there were three distinct populations of orientation patch sizes. A: A superficial CO section containing surface vasculature. B: A deeper section revealing the characteristic CO blobs of V1, which terminate at the V1/V2 border (solid line). C: An in vivo blood vessel pattern acquired under green light (see Materials and Methods). Dashed lines in A and C delineate sample vessels used to align with surface vasculature shown. D: Orientation map in V1, V2, and area anterior to V2. As in Figures 3 and 4, we used this information (A–D) to place the CO blob defined V1/V2 border onto our imaging maps. E,F: T-map (P < 0.05) of the orientation preference map shown in D. We determined those samples by using two sample regions (the superimposed light gray rectangles 1 mm in height). The bars were moved in an iterative fashion to arrive at this final location (see text). Only those patches lying within a single sample region were selected for measurement. Solid line, V1/V2 border; dotted line, estimated V2/V3 border; dashed line, estimated anterior V3 border. A, anterior; M, medial. Scale bar = 1 mm in C (applies to A–F).
Figure 13
Figure 13
Distribution of orientation preference patch sizes in V1, V2, and V3. Patches from orientation maps for V1, V2, and V3 were measured by using t-maps at a threshold of P < 0.05. The distribution shown is pooled data from four cases. Borders for V1, V2, and V3 were chosen based on all available combinations of histological and OIS data. Mann-Whitney U tests (uncorrected) were performed in pairs: V1 versus V2 and V2 versus V3. All were found to be significantly different (P < 0.005 for all comparisons; see Table 1). V1 patches: n = 187; V2 patches: n = 157; V3 patches: n = 79.

Similar articles

Cited by

References

    1. Adams DL, Zeki S. Functional organization of macaque V3 for stereoscopic depth. J Neurophysiol. 2001;86:2195–2203. - PubMed
    1. Allman JM, Kaas JH. The dorsomedial cortical visual area: a third tier area in the occipital lobe of the owl monkey (Aotus trivirgatus) Brain Res. 1975;100:473–487. - PubMed
    1. Allman J, Campbell CB, McGuinness E. The dorsal third tier area in Galago senegalensis. Brain Res. 1979;179:355–361. - PubMed
    1. Baizer JS. Receptive field properties of V3 neurons in monkey. Invest Ophthalmol Vis Sci. 1982;23:87–95. - PubMed
    1. Beck PD, Kaas JH. Cortical connections of the dorsomedial visual area in new world owl monkeys (Aotus trivir-gatus) and squirrel monkeys (Saimiri sciureus) J Comp Neurol. 1998a;400:18–34. - PubMed

Publication types