

Mechanical state, material properties and continuous description of an epithelial tissue
- PMID: 22628216
- PMCID: PMC3427523
- DOI: 10.1098/rsif.2012.0263
Mechanical state, material properties and continuous description of an epithelial tissue
Abstract
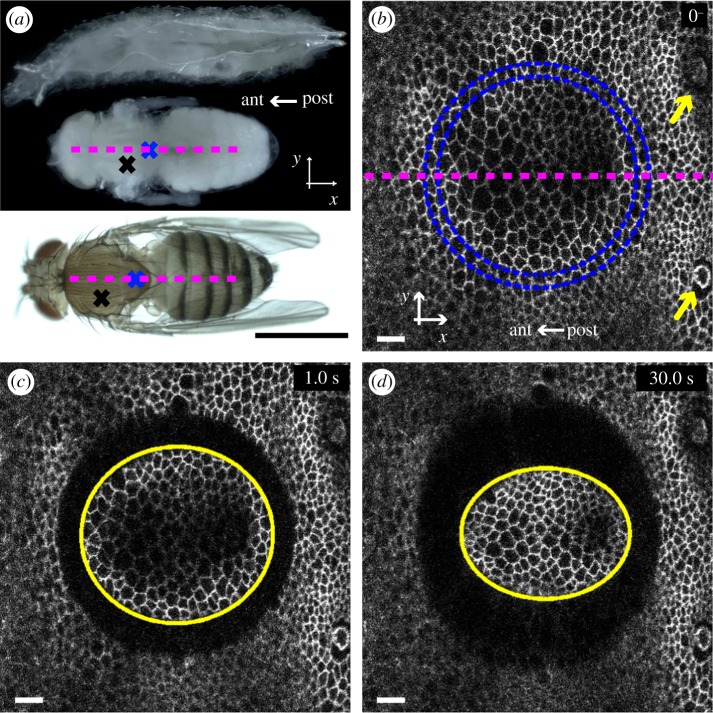
During development, epithelial tissues undergo extensive morphogenesis based on coordinated changes of cell shape and position over time. Continuum mechanics describes tissue mechanical state and shape changes in terms of strain and stress. It accounts for individual cell properties using only a few spatially averaged material parameters. To determine the mechanical state and parameters in the Drosophila pupa dorsal thorax epithelium, we severed in vivo the adherens junctions around a disc-shaped domain comprising typically a hundred cells. This enabled a direct measurement of the strain along different orientations at once. The amplitude and the anisotropy of the strain increased during development. We also measured the stress-to-viscosity ratio and similarly found an increase in amplitude and anisotropy. The relaxation time was of the order of 10 s. We propose a space-time, continuous model of the relaxation. Good agreement with experimental data validates the description of the epithelial domain as a continuous, linear, visco-elastic material. We discuss the relevant time and length scales. Another material parameter, the ratio of external friction to internal viscosity, is estimated by fitting the initial velocity profile. Together, our results contribute to quantify forces and displacements, and their time evolution, during morphogenesis.
Figures
 , stress-to-viscosity ratio
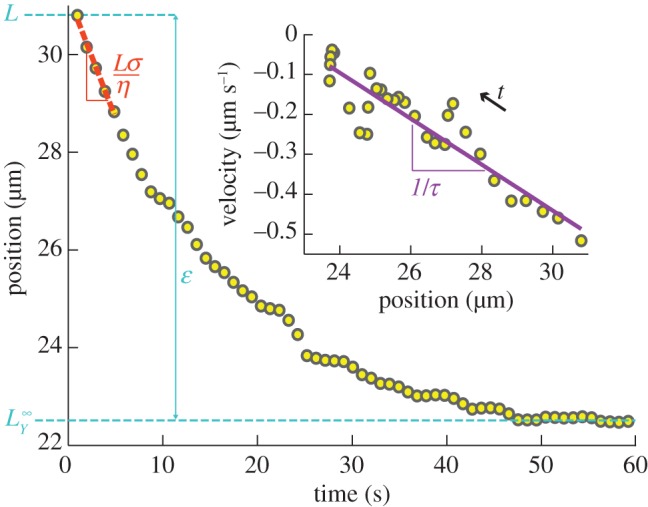
  and relaxation time τ. The wound margin position (ellipse semi-axis) is plotted versus time after severing; data from figure 1b–d, see electronic supplementary material, movie S3, along the y-axis. The difference between the initial (L) and final (
 ) positions (blue dashed lines) directly yields the value of
  The initial velocity
  (slope of the orange dashed line) yields an estimate of
  . Inset: velocity, estimated by finite differences of successive positions, versus the position during the first 30 s. An arrow indicates the direction of increasing time t. The slope of a linear fit (purple line) yields the inverse of the relaxation time,
  (see equation (3.2)).
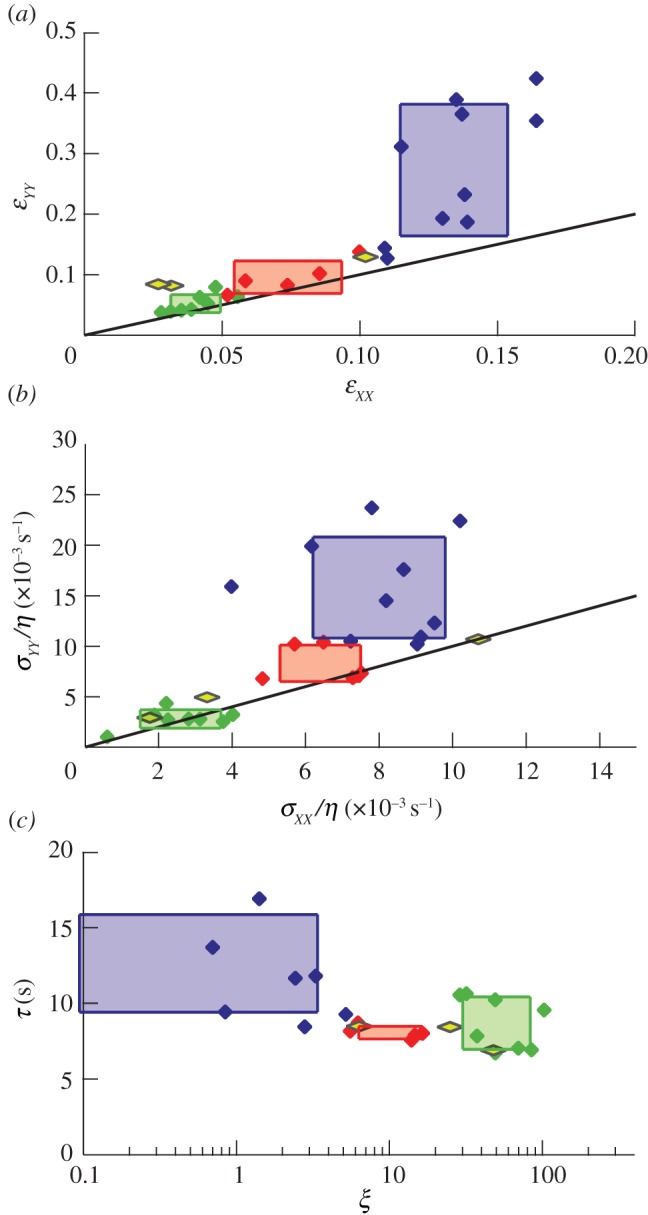
 versus
  . Note the difference in horizontal and vertical scales; the solid line is the first bisectrix y = x, indicating the reference for isotropy. (b) Same for the severed stress-to-viscosity ratio
  . (c) Relaxation time τ and dimensionless friction-to-viscosity ratio ξ; values are the averages of the measurements along the x- and y-axes (see electronic supplementary material, figure S3). Note the semi-log scale. The blue rectangle takes into account two very small values of ξ, of order 10−3 and 10−4 (below the plotted range).
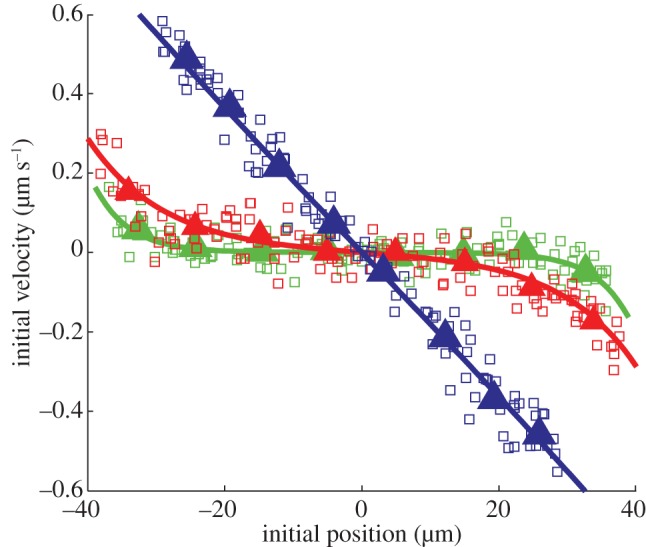
 (green),
  5 (red),
  (blue), respectively.
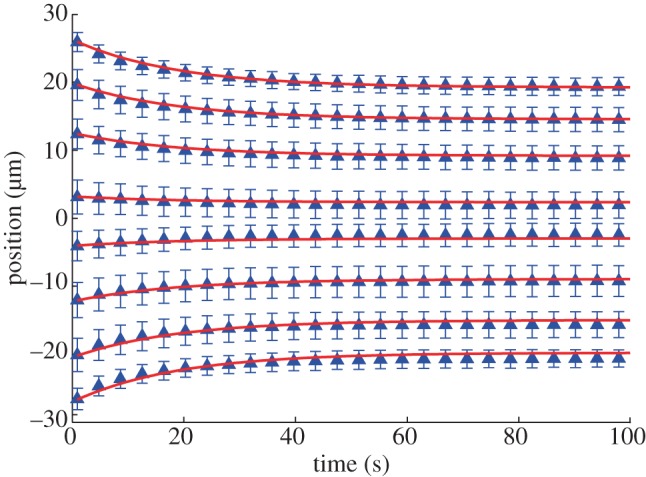
 ,
,  s.
s.References
-
- Lecuit T., Lenne P. F. 2007. Cell surface mechanics and the control of cell shape, tissue patterns and morphogenesis. Nat. Rev. Mol. Cell Biol. 8, 633–64410.1038/nrm2222 (doi:10.1038/nrm2222) - DOI - DOI - PubMed
-
- Chen C. S., Tan J., Tien J. 2004. Mechanotransduction at cell-matrix and cell-cell contacts. Annu. Rev. Biomed. Eng. 6, 275–30210.1146/annurev.bioeng.6.040803.140040 (doi:10.1146/annurev.bioeng.6.040803.140040) - DOI - DOI - PubMed
-
- Ma X., Lynch H. E., Scully P. C., Hutson M. S. 2009. Probing embryonic tissue mechanics with laser hole drilling. Phys. Biol. 6, 03600410.1088/1478-3975/6/3/036004 (doi:10.1088/1478-3975/6/3/036004) - DOI - DOI - PubMed
-
- Lecuit T., Le Goff L. 2007. Orchestrating size and shape during morphogenesis. Nature 450, 189–19210.1038/nature06304 (doi:10.1038/nature06304) - DOI - DOI - PubMed
-
- Mammoto T., Ingber D. E. 2010. Mechanical control of tissue and organ development. Development 137, 1407–142010.1242/dev.024166 (doi:10.1242/dev.024166) - DOI - DOI - PMC - PubMed
Publication types
MeSH terms
LinkOut - more resources
Full Text Sources
Molecular Biology Databases
