. 2012 Jul 6;337(6090):104-9.
doi: 10.1126/science.1219580. Epub 2012 May 24.

Recurrent hemizygous deletions in cancers may optimize proliferative potential

Affiliations

Recurrent hemizygous deletions in cancers may optimize proliferative potential

Nicole L Solimini et al. Science. .

Abstract

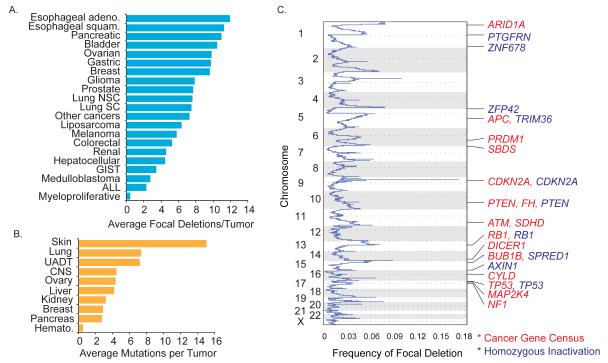
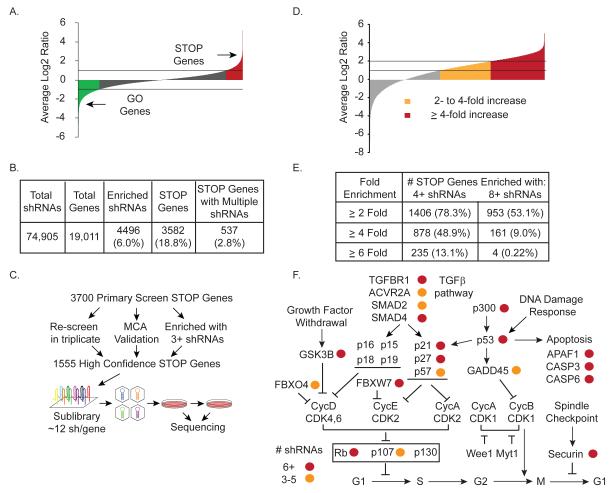
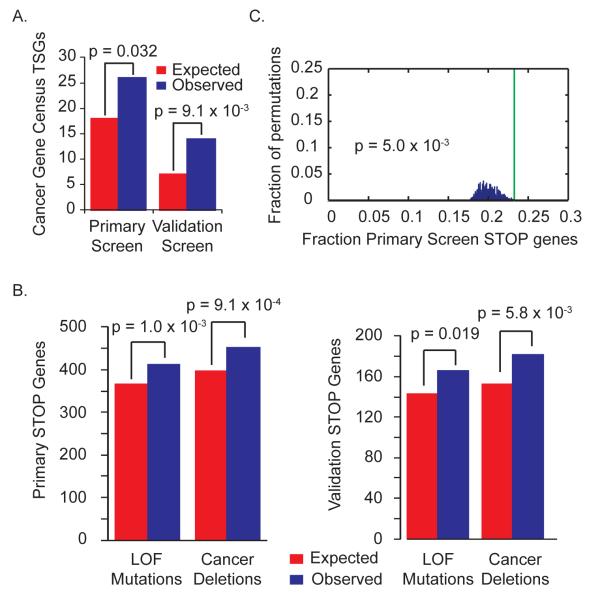
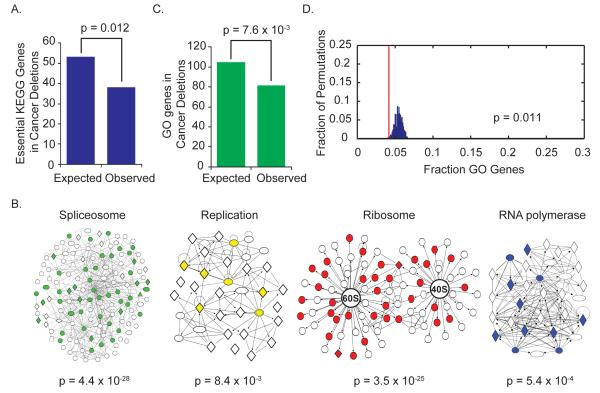
Tumors exhibit numerous recurrent hemizygous focal deletions that contain no known tumor suppressors and are poorly understood. To investigate whether these regions contribute to tumorigenesis, we searched genetically for genes with cancer-relevant properties within these hemizygous deletions. We identified STOP and GO genes, which negatively and positively regulate proliferation, respectively. STOP genes include many known tumor suppressors, whereas GO genes are enriched for essential genes. Analysis of their chromosomal distribution revealed that recurring deletions preferentially overrepresent STOP genes and underrepresent GO genes. We propose a hypothesis called the cancer gene island model, whereby gene islands encompassing high densities of STOP genes and low densities of GO genes are hemizygously deleted to maximize proliferative fitness through cumulative haploinsufficiencies. Because hundreds to thousands of genes are hemizygously deleted per tumor, this mechanism may help to drive tumorigenesis across many cancer types.


Figures

Fig. 1
Fig. 1. Most recurrent cancer deletions do not contain known or putative recessive TSGs
A) Average recurrent focal deletions per tumor for cancer subtypes (adeno: adenocarcinoma; squam: squamous; NSC: non-small cell; SC: small cell; GIST, gastrointestinal stromal tumor; ALL: acute lymphoblastic leukemia) B) Loss-of-function mutations per tumor from COSMIC, averaged for various cancers (UADT: upper aero-digestive tract, CNS: central nervous system, Hemato: hematopoietic) C) A subset of recurrent cancer deletions contains known or putative tumor suppressors. The frequency of focal deletion was plotted by chromosome location. Red gene names denote the presence of a known TSG from the Cancer Gene Census; blue gene names denote a homozygously inactivated gene from COSMIC whole-genome sequencing.
Fig. 2
Fig. 2. Identification of STOP gene candidates that restrain cell proliferation
A) A genome-wide proliferation screen identifies STOP and GO genes. Average log2 ratios of end vs. initial samples for > 74,000 shRNAs across triplicates were plotted. Enriched shRNAs are denoted as STOP genes (red); lethal shRNAs are denoted as GO genes (green). B) Numbers and percentages of STOP genes identified with single and multiple shRNAs, enriched shRNAs scoring in the primary screen, and total shRNAs and genes screened. C) Generation and screening of a validation sublibrary containing multiple shRNAs per gene. A sublibrary targeting 1555 high-confidence STOP genes was designed containing 12+ additional shRNAs per gene, shRNAs that enriched by a factor of 2 in the primary screens, and control shRNAs. The sublibrary was synthesized using parallel microarray synthesis, cloned, and screened for the ability to increase cell proliferation using Illumina sequencing for pool deconvolution. D) Average log2 ratios of end vs. initial samples across triplicates for 21,768 shRNAs from the validation screen were normalized for sequencing reads per sample and to the mean of 50 negative control shRNAs targeting FF. shRNAs that increased proliferation (relative to FF controls) by a factor of 2 to 4 are in orange; those that increased proliferation by a factor of 4 or more are in red. E) Validation of STOP genes as assessed by multiple shRNAs. Numbers and percentages of STOP genes with multiple shRNAs are shown, according to increased proliferation by a factor of ≥ 2, ≥ 4, ≥ 6. F) Known pathways with multiple shRNAs in the validation screen. Genes that validated in the secondary screen by a factor ≥ 4 with multiple shRNAs are denoted with circles corresponding to three to five (orange) and six or more shRNAs (red).
Fig. 3
Fig. 3. STOP genes are enriched for known TSGs and genes mutant or deleted in cancer
A) STOP genes are significantly enriched for known TSGs. Candidates from the primary or validation screens were compared to Cancer Gene Census TSGs using Fisher’s exact test. B) STOP gene candidates are significantly enriched for genes exhibiting loss-of-function (LOF) mutations and deletions in cancer. Genes containing loss-of-function mutations were determined using COSMIC whole-genome sequencing data. STOP genes from the primary or validation screens were mapped to genomic locations. Comparing STOP genes from the primary or validation screens to these lists of mutant or focally deleted genes revealed significant enrichment by Fisher’s exact test. C) Multiple STOP genes cluster in cancer deletions. The primary STOP gene set was mapped to genomic location, and cancer deletion peak regions were overlaid. The percent of STOP genes found in cancer deletion peaks (green line) was compared to the distribution observed after 1000 permutations of the deletion peak regions across the genome (14).
Fig. 4
Fig. 4. Hemizygous focal deletions avoid essential GO genes
A) Essential KEGG genes are depleted from cancer deletion peak regions. An essential KEGG gene set representing essential GO genes was assembled using all genes from the following processes: basal transcription and RNA polymerase, the spliceosome, the ribosome, DNA replication, fatty acid biosynthesis, amino-acyl tRNA synthesis, and mRNA transport. Genes were mapped to chromosomal locations and compared to genes found in recurrent cancer deletions. Significant depletion from recurrent deletions was observed using Fisher’s exact test. B) GO genes are enriched for genes involved in transcription, splicing, translation, and DNA replication. All genes included in the ribosome, spliceosome, RNA polymerase, and DNA replication KEGG pathways were assembled into interaction modules using Ingenuity Pathway Analysis (Ingenuity Systems, Redwood City, CA). GO genes are colored red, green, blue, and yellow, respectively, within each module to demonstrate enrichment for these pathways within the GO gene set using Fisher’s exact test. C) GO gene density is lower than expected in cancer deletions. GO genes were mapped to genomic locations and compared to genes found in deletions. Significant depletion was observed between GO genes and genes found in cancer deletion peaks using Fisher’s exact test. D) GO genes are significantly depleted from cancer deletions. The GO gene set was mapped to genomic location, and cancer deletion peak regions were overlaid. The percentage of GO genes found in cancer deletions (red line) was compared to the distribution observed after 1000 permutations of the deletion peak regions across the genome.

Comment in

References

    1. Luo J, Solimini NL, Elledge SJ. Principles of cancer therapy: oncogene and non-oncogene addiction. Cell. 2009 Mar 6;136:823. - PMC - PubMed
    1. Hanahan D, Weinberg RA. Hallmarks of cancer: the next generation. Cell. 2011 Mar 4;144:646. - PubMed
    1. Vogelstein B, Kinzler KW. Cancer genes and the pathways they control. Nat Med. 2004 Aug;10:789. - PubMed
    1. Bass AJ, et al. SOX2 is an amplified lineage-survival oncogene in lung and esophageal squamous cell carcinomas. Nat Genet. 2009 Nov;41:1238. - PMC - PubMed
    1. Garraway LA, et al. Integrative genomic analyses identify MITF as a lineage survival oncogene amplified in malignant melanoma. Nature. 2005 Jul 7;436:117. - PubMed

Publication types