. 2012 Jun 19;109(25):E1599-608.
doi: 10.1073/pnas.1120027109. Epub 2012 May 24.

Engineering rotor ring stoichiometries in the ATP synthase

Affiliations

Engineering rotor ring stoichiometries in the ATP synthase

Denys Pogoryelov et al. Proc Natl Acad Sci U S A. .

Abstract

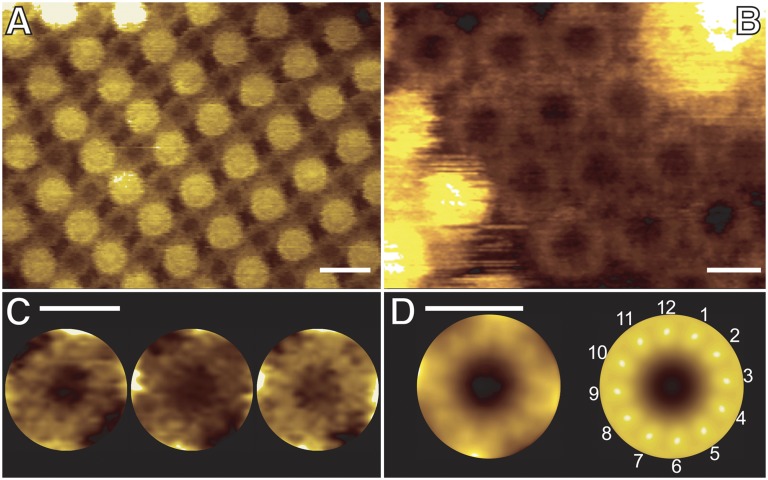
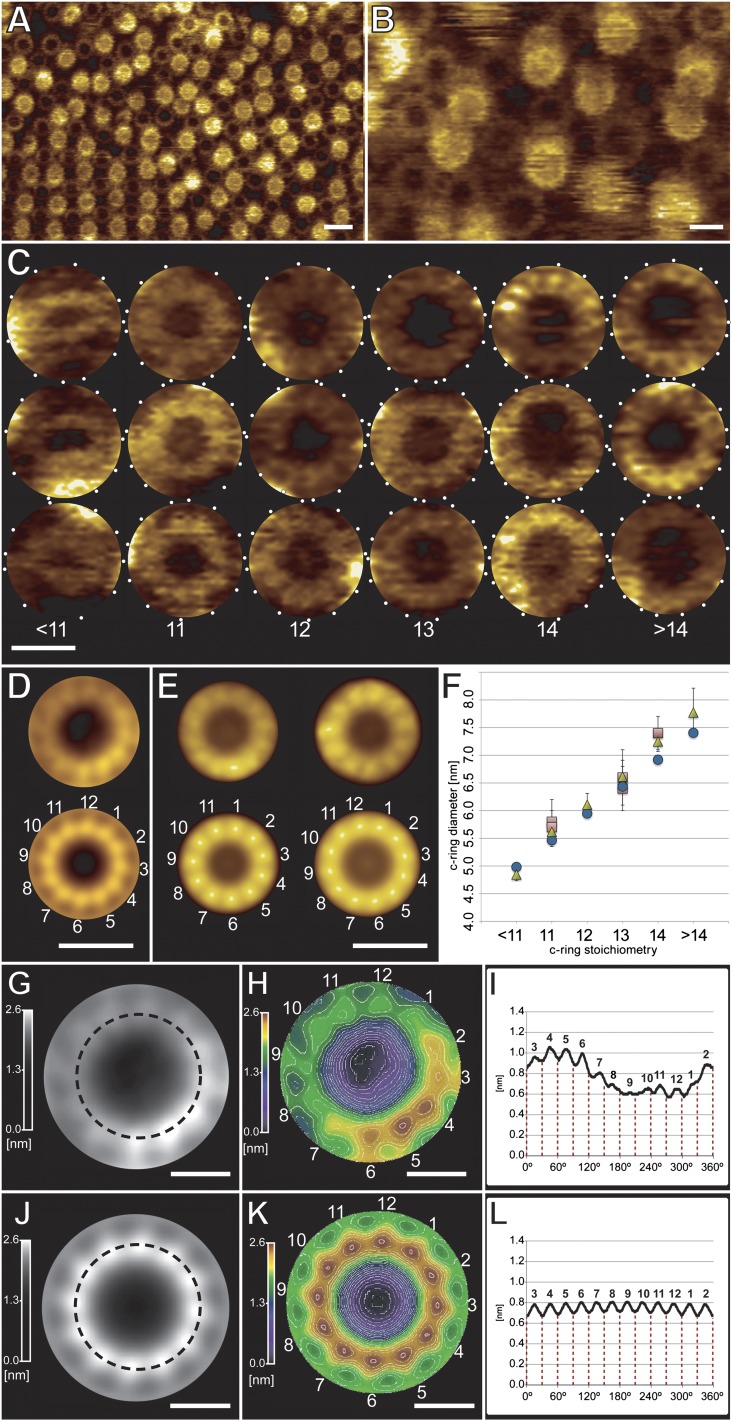
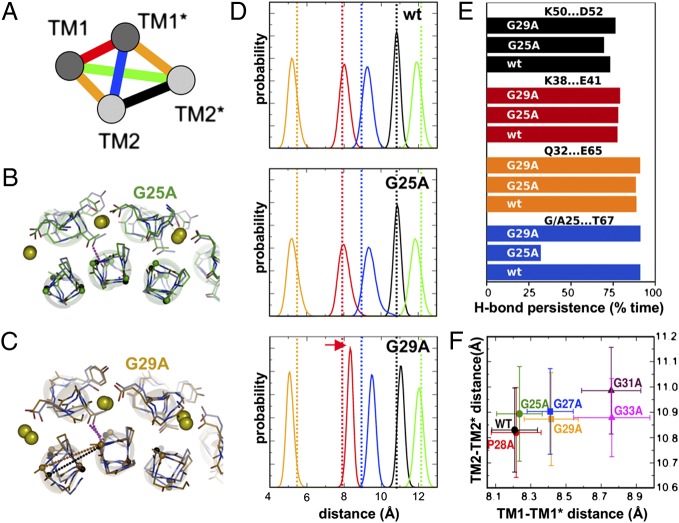
ATP synthase membrane rotors consist of a ring of c-subunits whose stoichiometry is constant for a given species but variable across different ones. We investigated the importance of c/c-subunit contacts by site-directed mutagenesis of a conserved stretch of glycines (GxGxGxGxG) in a bacterial c(11) ring. Structural and biochemical studies show a direct, specific influence on the c-subunit stoichiometry, revealing c(<11), c(12), c(13), c(14), and c(>14) rings. Molecular dynamics simulations rationalize this effect in terms of the energetics and geometry of the c-subunit interfaces. Quantitative data from a spectroscopic interaction study demonstrate that the complex assembly is independent of the c-ring size. Real-time ATP synthesis experiments in proteoliposomes show the mutant enzyme, harboring the larger c(12) instead of c(11), is functional at lower ion motive force. The high degree of compliance in the architecture of the ATP synthase rotor offers a rationale for the natural diversity of c-ring stoichiometries, which likely reflect adaptations to specific bioenergetic demands. These results provide the basis for bioengineering ATP synthases with customized ion-to-ATP ratios, by sequence modifications.


Conflict of interest statement

The authors declare no conflict of interest.

Figures

Fig. 1.
Fig. 1.
Structural arrangement of the c/c-subunit interface in the I. tartaricus c11 ring. A bundle of three neighboring c-subunits (chains A, B, and C) of Protein Data Bank (PDB) ID code 2WGM (11) is shown in surface/cartoon (A) or surface/stick (B and C) representation. (A) View from the c-ring center. (B) Close-up of view in A. The closest (>4 Å) atoms on the adjacent chains of glycines 25–33 are indicated by dashed lines. (C) Clipped view from the cytoplasm on the level of the Na+ binding site. The G25xGxGxGxG33 motif located at the inner (N-terminal) c/c-subunit interface is indicated by black spheres (Cα atoms). The Na+ ions are indicated by yellow spheres. For clarity, side chains are omitted, except for residues Pro28, Gln32, Glu65, Ser66, Thr67, and Tyr70.
Fig. 2.
Fig. 2.
SDS/PAGE and relative mobility regression analysis of purified I. tartaricus c-oligomers (wild type and mutants) heterologously expressed in E. coli. (A) Wild-type (WTc11) and mutant c-oligomers used in this study: G25A, G25S, G27A, P28A, G29A, G31A, G33A, and Q32A. (B and C) Quantification of the molecular masses (MW) of the c-oligomers for mutants G29A and G25A. The pt7cIT expression vector was used in B, and the pItTr5His expression vector was used in C. The marker c-rings with defined molecular masses are indicated. Abbreviations and known masses: I. tartaricus c11 wild type (WTc11), MW of c11: 96.7 kDa; MW of c1: 8.8 kDa; S. elongatus SAG 89.79 (SEc13), MW 103.6 kDa; Synechocystis sp. PCC 6803 (SCc14), MW 112 kDa; and S. platensis C1 (SPc15), MW 123 kDa. Dashed lines indicate the marker c-ring migration profiles and were used for calibration of the mutant I. tartaricus c-rings. (D) Regression analysis of relative c-ring mobilities. The molecular masses of the c-rings (in kDa) were plotted against their relative mobilities as determined in B and C. Relative mobility (Rm) from left to right: ○, SPc15, SCc14, SEc13, and WTc11; ◆, G25A; ●, G29A (bands a and b are indicated; see Results). Data represent average values and SDs (indicated by error bars) from five independent experiments. The dashed line represents a linear regression trend line, and the confidence intervals (P = 0.05) are displayed by dotted lines.
Fig. 3.
Fig. 3.
EM analysis of c-ring 2D crystals. Overview of 2D crystalline area of (A) G25A (no projection map obtained) and (B) G29A mutant c-rings negatively stained with uranyl acetate. (C) Projection map of G29A c11 ring at a resolution of 7 Å from six averaged cryo-EM images (plane group p1, unit cell 90.5 Å × 94.0 Å; 115.6°). (D) Overlay of projection maps: G29A c11 rings (red lines) and wild-type I. tartaricus c11 ring (black lines) from ref. . The projection map of the mutant G29A c11 ring shows features identical to the wild-type c11 ring, as previously described (16, 26). (Scale bars: 100 nm in A and B; 10 Å in C and D.)
Fig. 4.
Fig. 4.
High-resolution AFM topographs of G25A mutant c-rings embedded in lipid bilayers. (A and B) Overviews of crystalline (A) and densely packed (B) c-ring assemblies. (C) Gallery of individual c12 rings. (D) Nonsymmetrized (Left) and symmetrized (Right) reference-free single-particle averages of the cytoplasmic side of the c-rings from crystalline assemblies (n = 100). (Scale bars: 10 nm in A; 5 nm in B–D.)
Fig. 5.
Fig. 5.
High-resolution AFM topographs of G29A mutant c-rings embedded in lipid bilayers. (A and B) Overviews of crystalline (Bottom Left corner in A) and densely packed (A and B) c-ring assemblies. (C) Gallery of c-rings showing their variable stoichiometry ranging from c<11 to c>14. (D) Nonsymmetrized (Upper) and symmetrized (Lower) reference-free single-particle averages of the cytoplasmic side of the c-rings from crystalline assemblies (n = 160). (E) Nonsymmetrized (Upper) and symmetrized (Lower) reference-free single-particle averages of the cytoplasmic side of c-rings from the densely packed assemblies shown in A and B. Two major classes of the c-rings composed of 11 (Left; n = 92) and 12 (Right; n = 121) c-subunits were found. (F) Variable diameter and stoichiometry of G29A mutant c-rings. Cytoplasmic-side diameters of the c-rings found in G29A densely packed assemblies (green triangle): c<11 (n = 3), c11 (n = 25), c12 (n = 25), c13 (n = 14), c14 (n = 3), c>14 (n = 3). Pink squares represent previously published outer diameters of c-rings from different species measured by AFM; for references, see Fig. S10. Blue circles indicate c-rings with different stoichiometry. Diameters of the c<11 and c>14 rings were compared with the predicted diameter values for c10 and c15 rings, respectively. AFM measurements give average diameters (green triangles and pink squares) ± SD. (G) Nonsymmetrized average of the c12 ring showing the oval cross-section profile plane. (H) 3D projection of the nonsymmetrized average of the c12 ring using Dino3D. Numbers show densities corresponding to the c-subunits. White lines show the contours in 0.015-nm steps. (I) Cross-section profile of the nonsymmetrized average of the c12 ring along the oval using the ImageJ Oval Profile plug-in as indicated in G. Red dashed lines show the theoretical distribution of the 12 subunits around the oval of the c12 ring. (J) Symmetrized average of the c12 ring showing the oval cross-section plane. (K) 3D projection of the symmetrized average of the c12 ring using Dino3D. Numbers show densities corresponding to the c-subunits. White lines show the contours in 0.015-nm steps. (L) Cross-section profile of the symmetrized average of the c12 ring along the oval using the ImageJ Oval Profile plug-in as indicated in J. Red dashed lines show the theoretical distribution of the 12 subunits around the oval of the c12 ring. Color and gray scales in G, H, J, and K correspond to 2.6 nm in A–E. (Scale bars: 10 nm in A; 5 nm in B–E; 2 nm in G–H and J–K.)
Fig. 6.
Fig. 6.
Structural perturbations caused by G25A and G29A substitutions in the I. tartaricus c11 ring, from molecular dynamics simulations. (A) Transmembrane organization of the c/c-subunit interface in the c11 ring, viewed from the cytoplasmic side. (B) Overlay of the wild-type c11 crystal structure and a simulation snapshot of the G25A mutant (green). The H-bond between Gly25 and Thr67 in the wild-type c-ring is indicated. (C) Overlay of the wild-type crystal structure with a simulation snapshot of the G29A mutant (orange). Distances between adjacent inner helices (at position 28) are indicated for both systems. (D) Distances among inner (dark gray in A) and outer (light gray in A) helices in wild-type and mutant c11 rings. The simulation data are presented as probability distributions; crystal-structure values are indicated by dashed lines. Color coding is as in A. The values plotted correspond specifically to the distances between Cα atoms at positions 28 and 65 in the sequence, either within a given c-subunit or between adjacent subunits. Note the increase in the distance between inner helices (TM1) in G29A, relative to the wild type (red arrow). In contrast, no significant change can be discerned in G25A. (E) Stability of key H-bonds within and between c-subunits, in terms of the percentage of the simulation time. Color coding is as in A. Here, we consider that a H-bond exists when the donor–acceptor distance is ≤3.2 Å and the acceptor-donor–hydrogen angle is ≤20°. Note that G25A removes a key H-bond between inner helices in adjacent subunits. However, G29A is like the wild type in this regard. (F) Variability in the preferred geometry of c-subunit dimers upon mutation, in terms of the distances between the inner and outer helices within the c2 oligomer. The values plotted are time-averages; error bars correspond to the standard deviation of the average. The distances are measured as in panel (D).
Fig. 7.
Fig. 7.
In vitro assembly of hybrid rotor complexes and purification of ATP synthases with hybrid rotors. (A and B) SPR binding and dissociation kinetics of I. tartaricus c-ring mutants G25A and G29A (A) and c15 rings from S. platensis (B) to the γ/ε complex from I. tartaricus immobilized on a Ni2+-NTA surface of the sensor chip. Interaction kinetics were measured in c-ring concentrations ranging from 10–1,000 nM and were fitted with the single exponential binding model. The reference (wild-type I. tartaricus c11 ring) and representative kinetic traces are shown at 10 nM (A) and at 200 nM (B) concentrations of analyte. (C) Binding parameters/constants for the interaction of c-rings with immobilized γ/ε complex are shown in the table. Rate constants and Kd were calculated as described (29). Data represent the mean of three independent experiments ± SD. (D and E) SDS/PAGE gels showing the efficient in vitro reconstitution experiments of F1-rotor complex (subunits γ and ε) from I. tartaricus ATP synthase with the c11 rings of I. tartaricus (D, lane 3, WT) and c-rings of higher stoichiometries: c12 rings from G25A and G29A mutants (D, lanes 1 and 2, respectively) and c15 rings from S. platensis (SP) (E, lane 1). The reconstitution experiments were performed according to ref. by binding the c-rings to the His-tagged γ/ε-complex immobilized on the Ni2+-NTA agarose. The eluates were collected and analyzed by SDS/PAGE. The proteins used in this experiment are indicated on the left. ITc11- and SPc15 ring markers (E, lanes 2 and 3, respectively) are shown for comparison. (F) SDS/PAGE analysis of ATP synthases with mutations G25A (lane 2) and G29A (lane 3) in the c-subunit and the wild-type I. tartaricus ATP synthase (lane 1). His-tagged ATP synthases were heterologously expressed and isolated from E. coli DK8 pItTr5His cells.
Fig. 8.
Fig. 8.
Real-time ATP synthesis and hydrolysis of the I. tartaricus ATP synthase. Isolated ATP synthases were reconstituted in proteoliposomes with an internal [Na+] of 100 mM. ΔpNa and ΔΨ were varied by changing the NaCl and KCl concentrations, respectively, in the assay buffer. ΔΨ was preset to 0 mV (A and B), to 35 mV (C and D), or to 101 mV (E). The Q = [ATP]/[ADP][Pi] stoichiometric ratio in every experiment was set to Q = 0.09 (A, B, and E) or to Q = 0.32 (C and D) by adjusting the ATP concentration in the reaction mixture to 22 nM or 82 nM, respectively. (F) ATP synthesis and ATP hydrolysis as a function of the smf. Symbols represent initial rates of wild-type and G25A mutant enzyme synthesis or hydrolysis activities at the conditions as in AD. The threshold smf for ATP synthesis was determined from the linear regression fit of the data as the smf value at 0 rate of ATP catalysis. Black kinetic traces were recorded in presence of 1 μM monensin in the reaction mixture and at an imposed smf = 172 mV (C and D) and smf = 236 mV (E). The measurements were performed at 298 K; the pH of the reaction buffers was 7.5.
Fig. P1.
Fig. P1.
Engineered rotor rings in the ATP synthase influence the ion-to-ATP ratio. (A) Model of ATP synthase, a nanomolecular machine. The F1 complex harbors the headpiece (green) in which ADP and Pi is converted to ATP. This process is energized by the rotational motion of the rotor complex (blue), which contains a rotor ring embedded in the cell membrane. Torque in the membrane motor (Fo complex) is generated by the translocation of ions across the membrane. The rotor ring (c-ring) binds and releases the ions during enzyme operation. (B and C) Ion-to-ATP ratio (i) in the ATP synthase. Each rotor blade (c-subunit, blue) binds one ion. One full rotation transports n ions in a cn-ring. Each F1 converts three ATP per rotation (I, II, and III). i = n/3. (B) In the I. tartaricus wild-type c11 ring, i = 3.7. (C) In the mutant c12 ring, i = 4.0.

Similar articles

Cited by

References

    1. Abrahams JP, Leslie AGW, Lutter R, Walker JE. Structure at 2.8 Å resolution of F1-ATPase from bovine heart mitochondria. Nature. 1994;370:621–628. - PubMed
    1. von Ballmoos C, Wiedenmann A, Dimroth P. Essentials for ATP synthesis by F1F0 ATP synthases. Annu Rev Biochem. 2009;78:649–672. - PubMed
    1. Junge W, Sielaff H, Engelbrecht S. Torque generation and elastic power transmission in the rotary FoF1-ATPase. Nature. 2009;459:364–370. - PubMed
    1. Noji H, Yasuda R, Yoshida M, Kinosita K., Jr Direct observation of the rotation of F1-ATPase. Nature. 1997;386:299–302. - PubMed
    1. Iino R, Rondelez Y, Yoshida M, Noji H. Chemomechanical coupling in single-molecule F-type ATP synthase. J Bioenerg Biomembr. 2005;37:451–454. - PubMed

Publication types

MeSH terms

LinkOut - more resources