. 2012 Aug;53(8):1543-52.
doi: 10.1194/jlr.M025981. Epub 2012 May 23.

Activating transcription factor 4 regulates stearate-induced vascular calcification

Affiliations

Activating transcription factor 4 regulates stearate-induced vascular calcification

Masashi Masuda et al. J Lipid Res. 2012 Aug.

Abstract

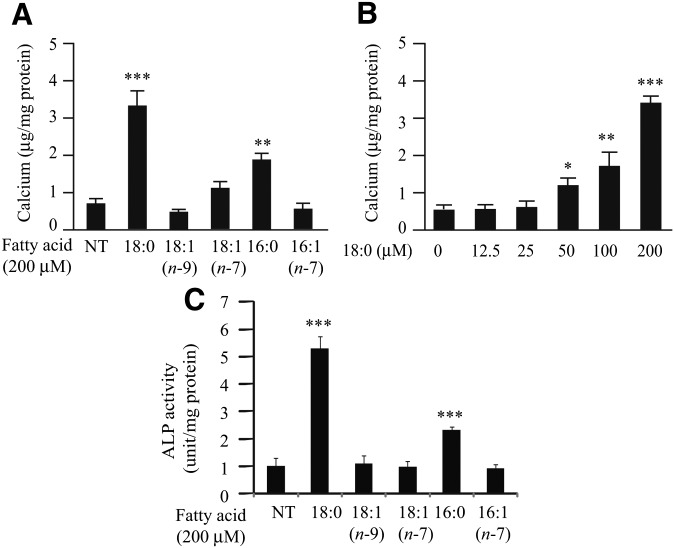
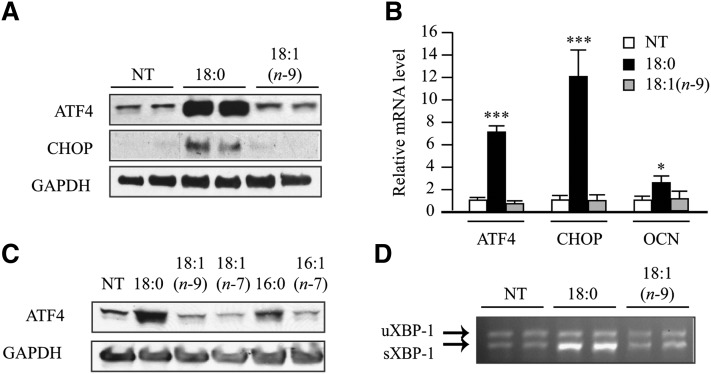
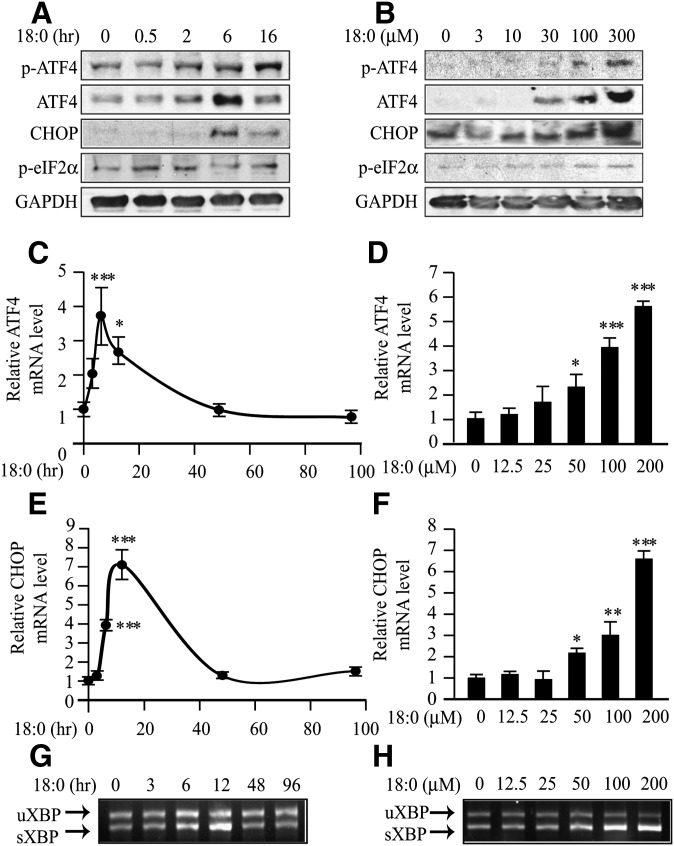
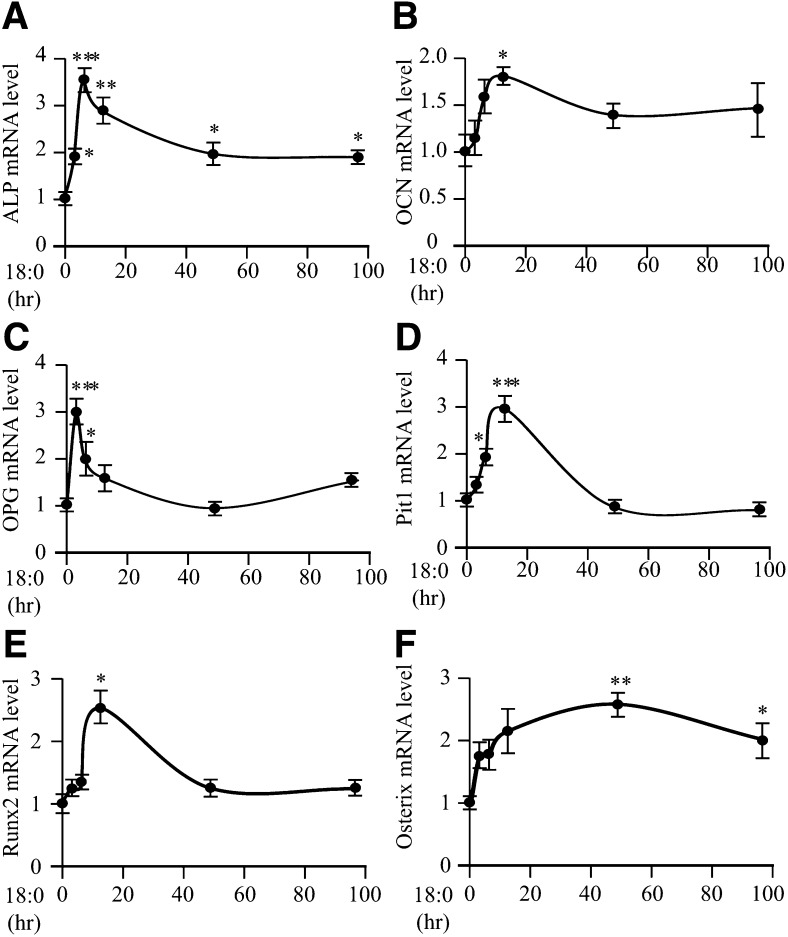
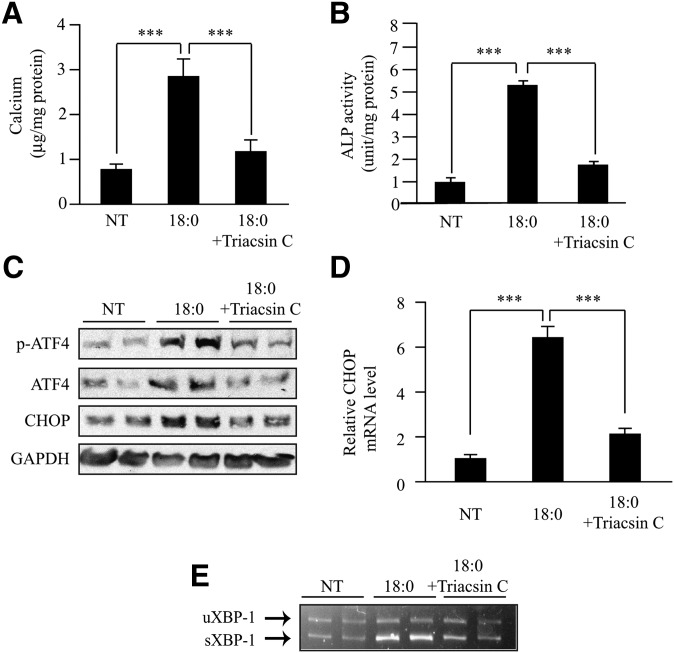
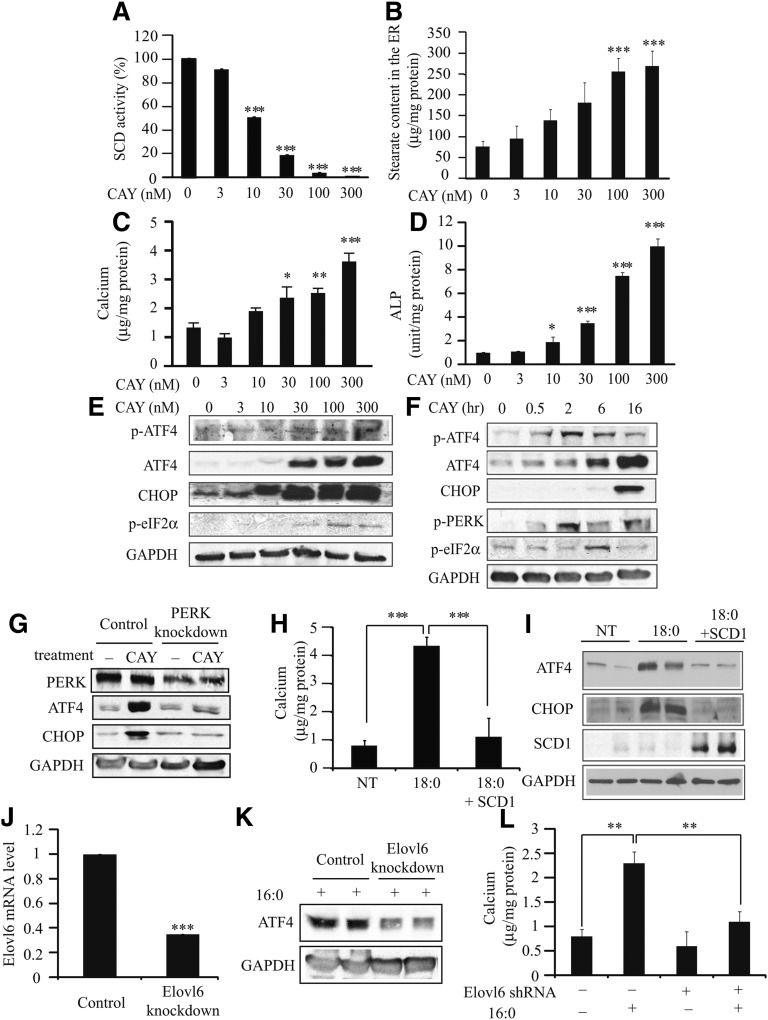
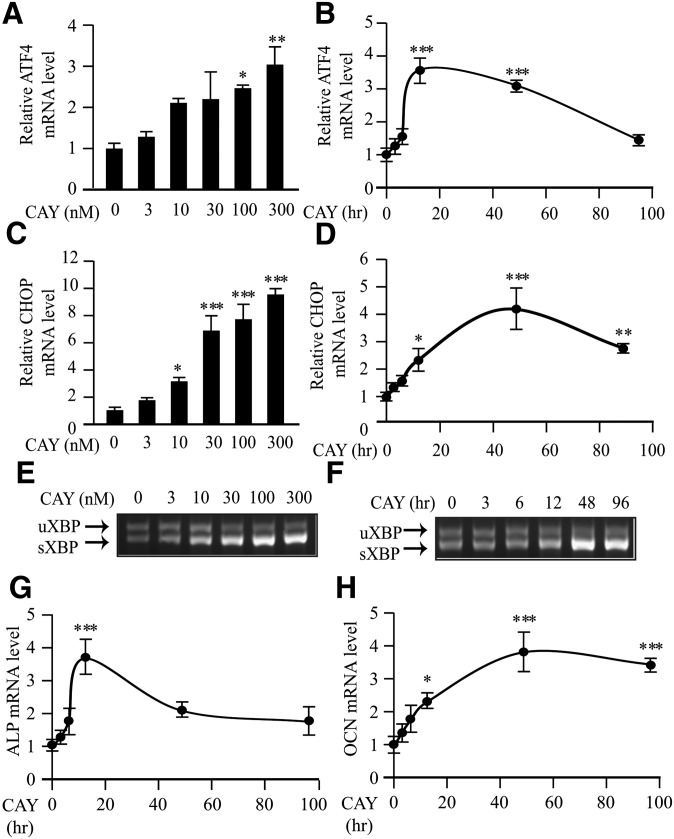
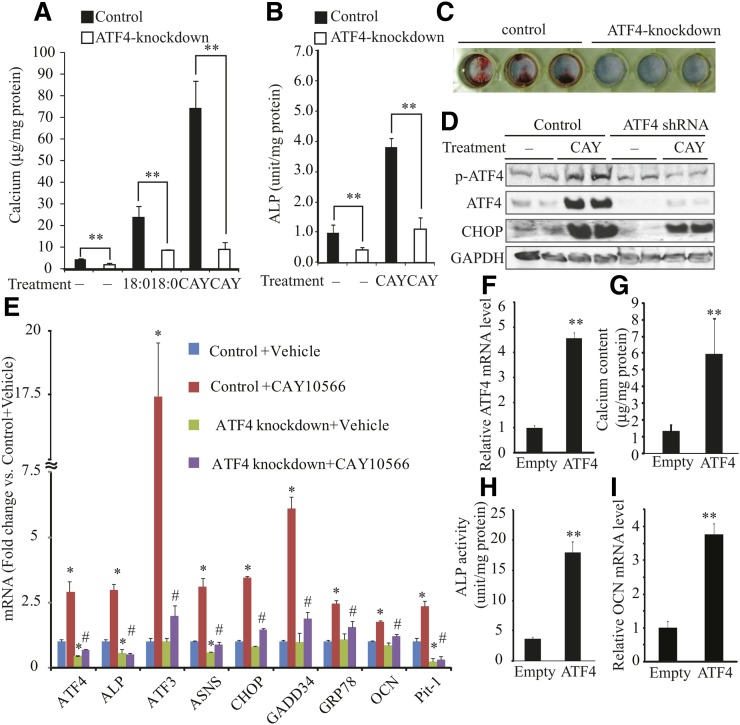
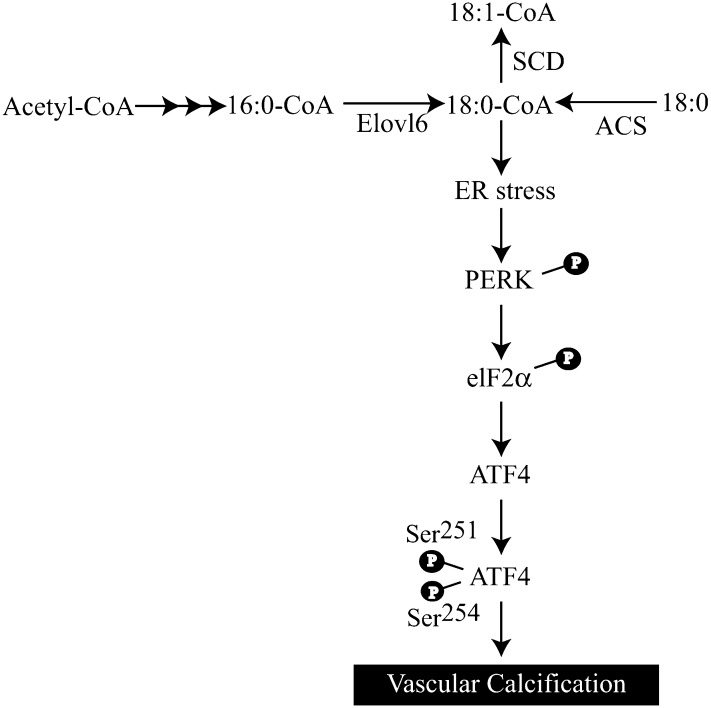
Previously, we reported that stearate, a saturated fatty acid, promotes osteoblastic differentiation and mineralization of vascular smooth muscle cells (VSMC). In this study, we examined the molecular mechanisms by which stearate promotes vascular calcification. ATF4 is a pivotal transcription factor in osteoblastogenesis and endoplasmic reticulum (ER) stress. Increased stearate by either supplementation of exogenous stearic acid or inhibition of stearoyl-CoA desaturase (SCD) by CAY10566 induced ATF4 mRNA, phosphorylated ATF4 protein, and total ATF4 protein. Induction occurred through activation of the PERK-eIF2α pathway, along with increased osteoblastic differentiation and mineralization of VSMCs. Either stearate or the SCD inhibitor but not oleate or other fatty acid treatments also increased ER stress as determined by the expression of p-eIF2α, CHOP, and the spliced form of XBP-1, which were directly correlated with ER stearate levels. ATF4 knockdown by lentiviral ATF4 shRNA blocked osteoblastic differentiation and mineralization induced by stearate and SCD inhibition. Conversely, treatment of VSMCs with an adenovirus containing ATF4 induced vascular calcification. Our results demonstrated that activation of ATF4 mediates vascular calcification induced by stearate.


Figures

Fig. 1.
Fig. 1.
Stearate induces mineralization in MOVAS-1 cells. (A–C) MOVAS-1 cells were treated with a fatty acid-BSA complex for 7 days in the presence of 5.0 mM glycerophosphate. (A) Calcium content in MOVAS-1 cells treated with the indicated fatty acids at 200 μM. (B) Calcium content in MOVAS-1 cells treated with various concentrations of stearate for 7 days. (C) ALP activity in MOVAS-1 cells treated with the indicated fatty acids at 200 μM.
Fig. 2.
Fig. 2.
Stearate induces ATF4 expression in MOVAS-1 cells. (A–D) MOVAS-1 cells were treated with the indicated fatty acids [palmitate (16:0), palmitoleate (16:1n-7), stearate (18:0), oleate (18:1n-9), and vaccenate (18:1n-7)] at 200 μM for 6 h (A) or 12 h (B and C) in the presence of 5.0 mM glycerophosphate. (A) ATF4 and CHOP protein were detected by immunoblot analysis with specific antibodies. GAPDH was used as a loading control. (B) ATF4, CHOP, and OCN mRNA. (C) ATF4 expression in MOVAS-1 cells treated with the indicated fatty acids at 200 μM for 12 h. (D) RT-PCR analysis of XBP-1 in MOVAS-1 cells. The upper band is the expression of unspliced forms of XBP-1 mRNA (uXBP-1) and the lower is the expression of spliced forms of XBP-1 mRNA (sXBP-1).
Fig. 3.
Fig. 3.
Stearate induces unfolded protein response (ER stress) in MOVAS-1 cells. (A) Time-dependent effect of stearate on ATF4 expression. MOVAS-1 cells were treated with 200 μM stearate (18:0) and 5.0 mM glycerophosphate for various periods as indicated. Phosphorylated-ATF4 (p-ATF4), total ATF4 (ATF4), CHOP, and phosphorylated eIF2α (p-eIF2α) protein were detected by immunoblot analysis with specific antibodies. GAPDH was used as a loading control. (B) Dose-dependent effect of stearate. MOVAS-1 cells were treated with different concentrations of stearate (18:0) for 6 h. (C and D) ATF4 mRNA. (E and F) CHOP mRNA was analyzed with RT-qPCR analysis. (G and H) RT-PCR analysis of XBP-1 in MOVAS-1 cells. (C, E, and G) MOVAS-1 cells were treated with 200 μM stearate (18:0) for the indicated periods (0, 3, 6, 12, 48, and 96 h). (D, F, and H) MOVAS-1 cells were treated with various concentrations of stearate (18:0) for 12 h. (G and H) The PCR products were digested with PstI. The upper band is the expression of unspliced forms of XBP-1 mRNA (uXBP-1), and the lower is the expression of spliced forms of XBP-1 mRNA (sXBP-1). *P < 0.05, **P < 0.01, ***P < 0.001.
Fig. 4.
Fig. 4.
Stearate induces gene expression of osteogenic transcription factors and markers. MOVAS-1 cells were treated with 200 μM stearate (18:0) for the indicated periods (0, 3, 6, 12, 48, and 96 h). (A−F) ALP (A), OCN (B), OPG (C), Pit1 (D), Runx2 (E), and Osterix (F) gene expression in MOVAS-1 cells. *P < 0.05, **P < 0.01, ***P < 0.001.
Fig. 5.
Fig. 5.
Inhibition of acyl-CoA synthetase blocks mineralization and ER stress induced by stearate treatment. (A) Calcium content in MOVAS-1 cells treated with triacsin C (5 μM, acyl-CoA synthetase inhibitor) for 7 days in the presence of 200 μM stearate (18:0) and 5.0 mM glycerophosphate. (B) ALP activity. (C) MOVAS-1 cells were treated with 200 μM stearate for 10 h in the presence of 5 μM triacsin C. Phosphorylated ATF4 (p-ATF4), total ATF4 (ATF4), and CHOP protein were detected by immunoblot analysis with specific antibodies. GAPDH was used as a loading control. (D and E) MOVAS-1 cells were treated with triacsin C (5 μM) for 12 h in the presence of 200 μM stearate (18:0). (D) CHOP mRNA. (E) RT-PCR analysis of XBP-1 in MOVAS-1 cells. ***P < 0.001.
Fig. 6.
Fig. 6.
SCD activity and ER stearate levels regulate ATF4 expression through PERK-eIF2α pathway, mineralization, and osteoblastic differentiation. MOVAS-1 cells were treated with different concentrations of CAY10566 (0, 3, 10, 30, 100, and 300 nM) for 16 h (A and B) or for 7 days in (C and D) in the presence of glycerophosphate. (A) SCD activity was measured using 14C-stearic acid. (B) Stearate content in the ER was measured by GC. (C) Calcium content. (D) ALP activity. MOVAS-1 cells were treated with different concentrations of CAY10566. (E and F) ER stress. MOVAS-1 cells were treated with CAY10566 (SCD1 inhibitor) at the indicated times (0, 0.5, 2, 6, and 16 h) and concentrations (0, 3, 10, 30, 100, and 300 nM). Phosphorylated ATF4 (p-ATF4), total ATF4 (ATF4), CHOP, and phosphorylated eIF2α (p-eIF2α) proteins were detected by immunoblot analysis with specific antibodies. GAPDH was used as a loading control. (G) ATF4 and CHOP protein expression in PERK knockdown MOVAS-1 cells treated with CAY10566. PERK-knockdown MOVAS-1 cells were treated with 300 nM CAY10566 for 16 h. (H) Calcium content and (I) ATF4 and CHOP expression in MOVAS-1 cells treated with an adenovirus containing SCD1. MOVAS-1 cells were treated with an adenovirus containing SCD1 at a MOI of 40 for 3 h and then incubated for 7 days (H) or 8 h (I) in the presence of 200 μM stearate (18:0) and 5.0 mM glycerophosphate. (J) Elovl6 mRNA expression, (K) ATF4 protein expression, and (L) calcium content in Elovl6-knockdown MOVAS-1 cells. Elovl6-knockdown MOVAS-1 cells were treated with 200 μM palmitate (16:0) and 5.0 mM glycerophosphate for 6 h (J) and 7 days (K). *P < 0.05, **P < 0.01, ***P < 0.001 versus no treatment.
Fig. 7.
Fig. 7.
SCD inhibition induces the expression of ER stress and osteogenic markers. (A and B) ATF4 mRNA. (C and D) CHOP mRNA. (E and F) RT-PCR analysis of XBP-1 in MOVAS-1 cells treated with CAY10566 in the presence of 5.0 mM glycerolphosphate. The upper band is the expression of unspliced forms of XBP-1 mRNA (uXBP-1), and the lower is the expression of spliced forms of XBP-1 mRNA (sXBP-1). (G) ALP mRNA and (H) OCN mRNA. (A, C, and E) mRNA levels were analyzed at 24 h of CAY10566 treatment. (B, D, F, G, and H) CAY10566 was used at 300 nM.
Fig. 8.
Fig. 8.
ATF4 expression alters mineralization and osteoblastic differentiation of VSMCs induced by stearate and SCD inhibitor CAY10566. (A) Mineralization and (B) ALP activity of ATF4-knockdown MOVAS-1 cells treated with stearate (200 μM) and CAY10566 (300 nM) for 7 days in the presence of high-phosphate (3.0 mM) conditions. (C) Alizarin staining in MOVAS-1 cells treated with CAY10566. ATF4-knockdown MOVAS-1 cells were treated with 300 nM CAY10566 for 7 days and stained with Alizarin red. (D) p-ATF4, total ATF4, and CHOP protein expression in ATF4-knockdown MOVAS-1 cells treated with CAY10566 for 30 min for p-ATF4 expression and for 6 h for other protein expression. GAPDH was used as a loading control. (E) Control and ATF4-knockdown MOVAS-1 cells were treated with CAY10566 (300 nM) for 12 h. Changes in gene expression are reported as ratios relative to the vehicle control.*P < 0.05 versus control MOVAS-1 cells with vehicle. #P < 0.05 versus control MOVAS-1 cells with CAY10566. (F) ATF4 mRNA expression in MOVAS-1 cells treated with adenoviruses containing ATF4 (Ad-ATF4) or empty (Ad-empty) at a MOI of 40 for 6 h. (G) Mineralization and (H) ALP activity of VSMCs overexpressing ATF4. MOVAS-1 cells were treated with either Ad-ATF4 or Ad-empty for 6 h and then incubated for 7 days. (I) OCN mRNA levels were analyzed after 6 h of adenovirus treatment.
Fig. 9.
Fig. 9.
Proposed mechanism by which stearate promotes vascular calcification. Palmitate (16:0), derived from lipoproteins and de novo lipogenesis, is elongated to stearate (18:0) in the ER. To induce ER stress, stearate has to be converted to the CoA-conjugated form. Stearoyl-CoA is incorporated into an ER membrane lipid, leading to ER stress that induces the expression of ATF4 through the activation of the PERK-eIF2α pathway. Activated ATF4 induces osteoblastic differentiation and mineralization in VSMCs.

References

    1. Mizobuchi M., Towler D., Slatopolsky E. 2009. Vascular calcification: the killer of patients with chronic kidney disease. J. Am. Soc. Nephrol. 20: 1453–1464 - PubMed
    1. Shanahan C. M., Crouthamel M. H., Kapustin A., Giachelli C. M. 2011. Arterial calcification in chronic kidney disease: key roles for calcium and phosphate. Circ. Res. 109: 697–711 - PMC - PubMed
    1. Li X., Yang H. Y., Giachelli C. M. 2006. Role of the sodium-dependent phosphate cotransporter, Pit-1, in vascular smooth muscle cell calcification. Circ. Res. 98: 905–912 - PubMed
    1. Tintut Y., Patel J., Parhami F., Demer L. L. 2000. Tumor necrosis factor-alpha promotes in vitro calcification of vascular cells via the cAMP pathway. Circulation. 102: 2636–2642 - PubMed
    1. Luo G., Ducy P., McKee M. D., Pinero G. J., Loyer E., Behringer R. R., Karsenty G. 1997. Spontaneous calcification of arteries and cartilage in mice lacking matrix GLA protein. Nature. 386: 78–81 - PubMed

Publication types

MeSH terms