. 2012 May 25;336(6084):1040-4.
doi: 10.1126/science.1218595.

Metabolite profiling identifies a key role for glycine in rapid cancer cell proliferation

Affiliations

Metabolite profiling identifies a key role for glycine in rapid cancer cell proliferation

Mohit Jain et al. Science. .

Abstract

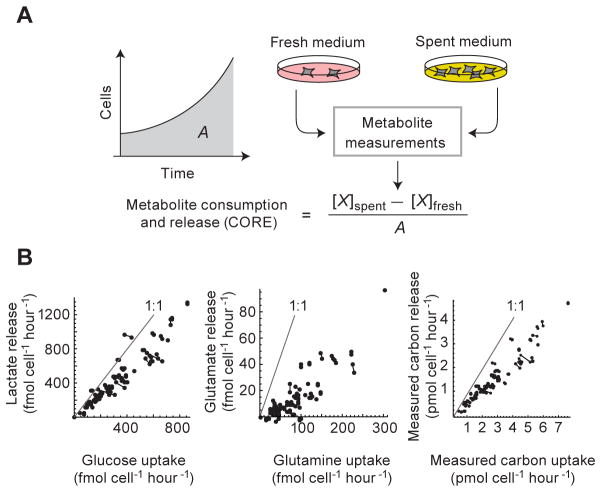
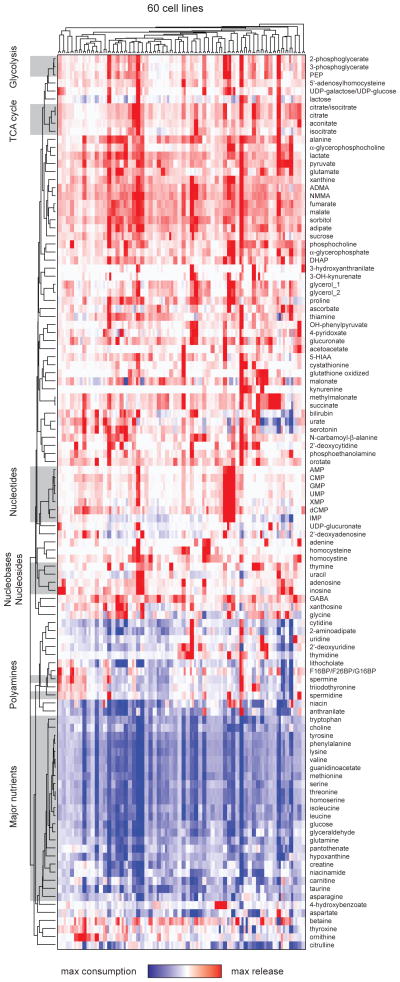
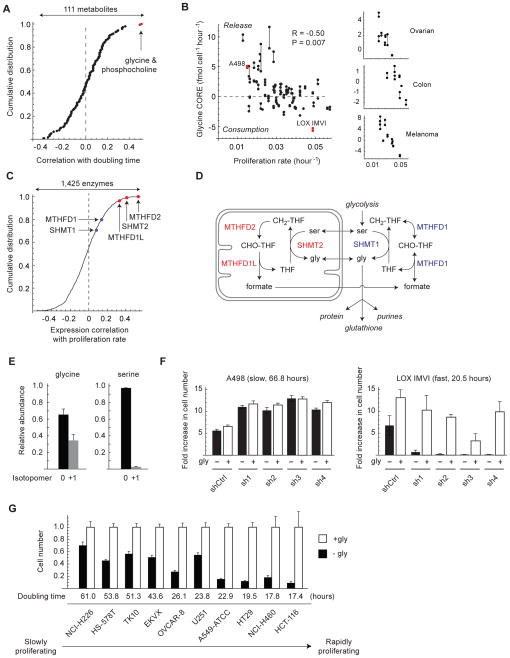
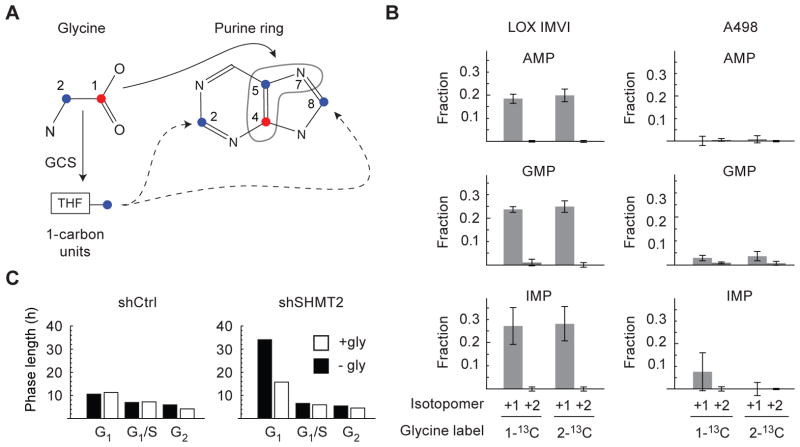
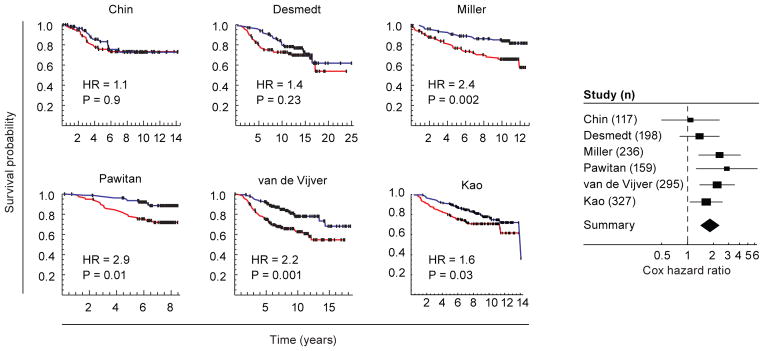
Metabolic reprogramming has been proposed to be a hallmark of cancer, yet a systematic characterization of the metabolic pathways active in transformed cells is currently lacking. Using mass spectrometry, we measured the consumption and release (CORE) profiles of 219 metabolites from media across the NCI-60 cancer cell lines, and integrated these data with a preexisting atlas of gene expression. This analysis identified glycine consumption and expression of the mitochondrial glycine biosynthetic pathway as strongly correlated with rates of proliferation across cancer cells. Antagonizing glycine uptake and its mitochondrial biosynthesis preferentially impaired rapidly proliferating cells. Moreover, higher expression of this pathway was associated with greater mortality in breast cancer patients. Increased reliance on glycine may represent a metabolic vulnerability for selectively targeting rapid cancer cell proliferation.


Conflict of interest statement

All authors declare no competing financial interests.

Figures

Figure 1
Figure 1. Metabolite consumption and release (CORE) profiling
A: For determining metabolite CORE (consumption and release rate) profiles, medium samples taken before (fresh) and after (spent) 4–5 days of cell culture are subjected to metabolite profiling using LC-MS/MS. For each metabolite X, the CORE value is calculated as the difference in molar abundance normalized to the area A under the growth curve. B: Glucose consumption vs. lactate release; glutamine consumption vs. glutamate release; and total measured carbon consumption vs. total measured carbon release, across the 60 cell lines. Gray lines indicate the 1:1 molar ratio of carbon consumed: carbon released for each metabolite pair; joined data points represent biological replicates.
Figure 2
Figure 2. CORE profiling across the NCI60 cell lines
Hierarchical clustering of CORE profiles for 111 metabolites across 60 cancer cell lines, in duplicate cultures. Blue color indicates consumption, white indicates no change, and red color indicates release. Gray highlights indicate functionally related metabolites. Metabolites that cannot be distinguished are denoted as x/y. Glycerol_1 and glycerol_2 represent independent LC-MS/MS measures.
Figure 3
Figure 3. Glycine consumption and synthesis are correlated with rapid cancer cell proliferation
A: Distribution of Spearman correlations between 111 metabolite CORE profiles and proliferation rate across 60 cancer cell lines. Metabolites highlighted in red are significant at P < 0.05, Bonferroni-corrected. B: Glycine CORE versus proliferation rate across 60 cancer cell lines (left) and selected solid tumor types (right). Cell lines selected for follow-up experiments are highlighted in red. Joined data points represent replicate cultures. P-value is Bonferroni-corrected for 111 tested metabolites. C: Distribution of Spearman correlations between gene expression of 1,425 metabolic enzymes and proliferation rates across 60 cancer cell lines. Highlighted are mitochondrial (red) and cytosolic (blue) glycine metabolism enzymes. D: Schematic of cytosolic and mitochondrial glycine metabolism. E: Abundance of unlabeled (0) and labeled (+1) intracellular glycine and serine in LOX IMVI cells grown on 100% extracellular 13C-glycine. F. Growth of LOX IMVI and A498 cells expressing shRNAs targeting SHMT2 (sh1-4) or control shRNA (shCtrl), normalized to shCtrl cells; gly, glycine. G. Growth of 10 cancer cell lines expressing shRNA targeting SHMT2 (sh4) after 3 days cultured the absence (−gly, filled bars) or presence (+gly, open bars) of glycine. Cell number is presented as a ratio relative to +gly cells. Error bars in E,F,G denote standard deviation.
Figure 4
Figure 4. Glycine metabolism supports de novo purine nucleotide biosynthesis
A: Schematic of carbon incorporation into the purine ring from 1-13C-glycine or 2-13C-glycine; THF, tetrahydrofolate; GCS, glycine cleavage system. B: Purine nucleotide +1 and +2 isotopomers in LOX IMVI or A498 cells grown on 100% 1-13C-glycine or 2-13C-glycine, as a fraction of the total intracellular metabolite pool. C. Cell cycle analysis in HeLa cells expressing shRNA targeting SHMT2 (shSHMT2) or control shRNA (shCtrl), grown in the absence (−gly, filled bars) or presence (+gly, open bars) of glycine. Cell cycle phase length was calculated from the percentage of cells present in each cell cycle phase by geminin expression and DAPI staining (Fig. S11C).
Figure 5
Figure 5. Expression of the mitochondrial glycine biosynthesis pathway is associated with mortality in breast cancer patients
Left, Kaplan-Meier survival analysis of six independent breast cancer patient cohorts (–27). Patients were separated into above (red line) and below (blue line) median expression of mitochondrial glycine metabolism enzymes (SHMT2, MTHFD2, and MTHFD1L, Fig. 3D). Dashes, censored events. Right, meta-analysis of Cox hazard ratios for the six studies. Solid lines denote 95% confidence intervals; boxes denote the relative influence of each study over the results (inverse squared standard error). Diamond marks the overall 95% confidence interval.

Comment in

References

    1. Nowell PC. The clonal evolution of tumor cell populations. Science. 1976;194:23. - PubMed
    1. Hanahan D, Weinberg RA. Hallmarks of cancer: the next generation. Cell. 2011;144:646. - PubMed
    1. Stratton MR, Campbell PJ, Futreal PA. The cancer genome. Nature. 2009;458:719. - PMC - PubMed
    1. Hsu PP, Sabatini DM. Cancer cell metabolism: Warburg and beyond. Cell. 2008;134:703. - PubMed
    1. Sreekumar A, et al. Metabolomic profiles delineate potential role for sarcosine in prostate cancer progression. Nature. 2009;457:910. - PMC - PubMed

Publication types

MeSH terms