

Transcriptome sequencing of and microarray development for a Helicoverpa zea cell line to investigate in vitro insect cell-baculovirus interactions
- PMID: 22629315
- PMCID: PMC3356360
- DOI: 10.1371/journal.pone.0036324
Transcriptome sequencing of and microarray development for a Helicoverpa zea cell line to investigate in vitro insect cell-baculovirus interactions
Abstract
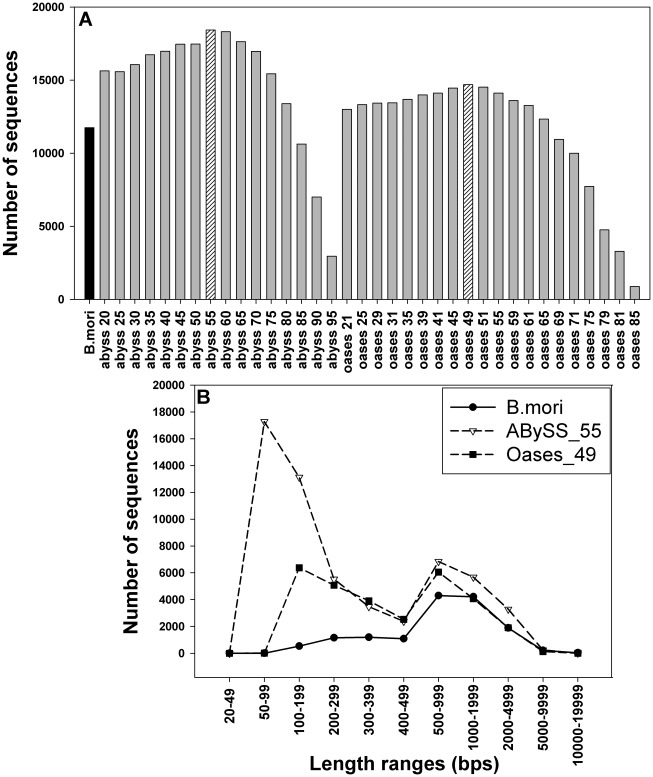
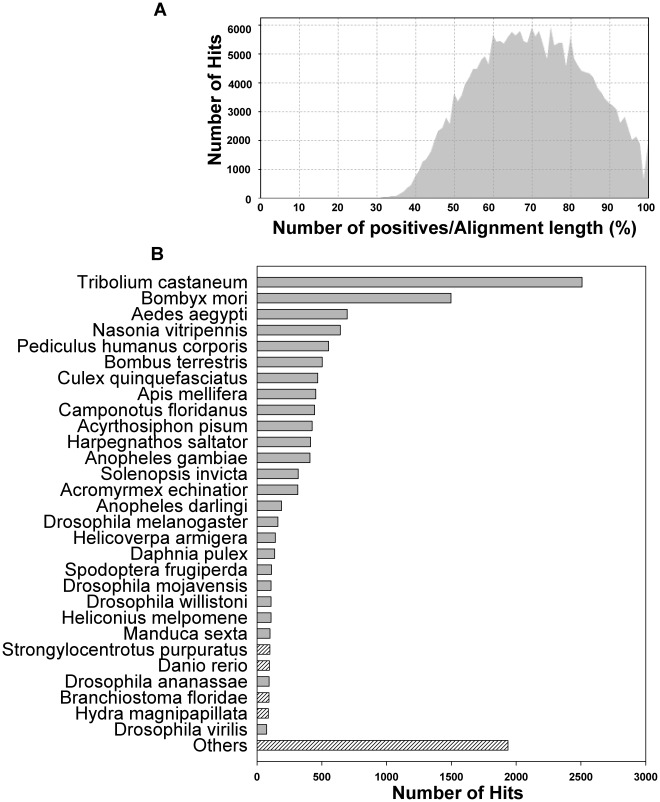
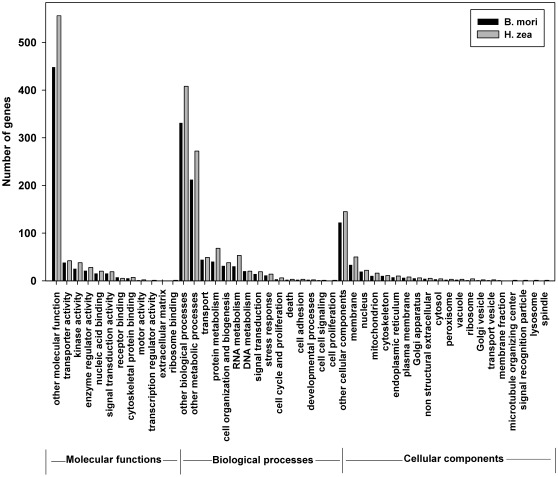
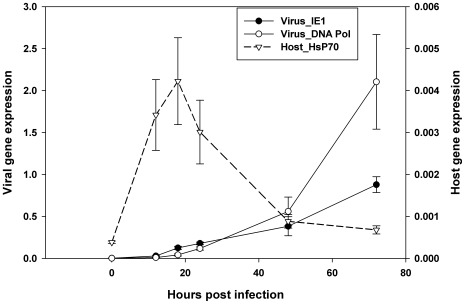
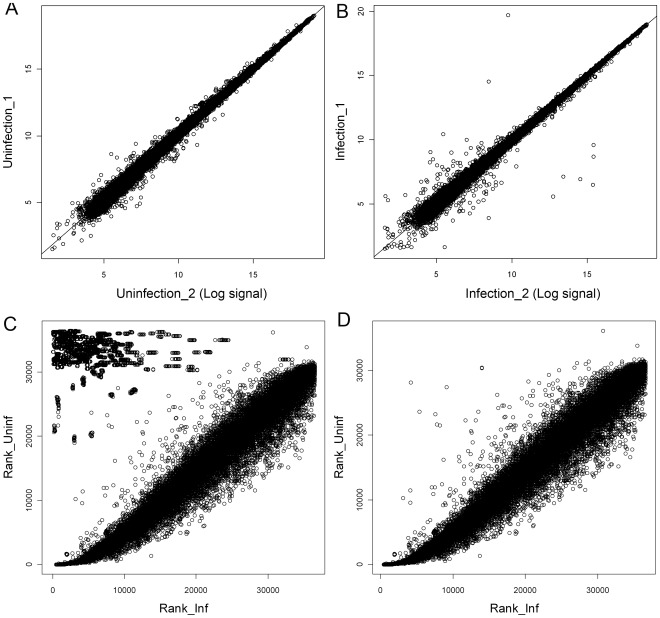
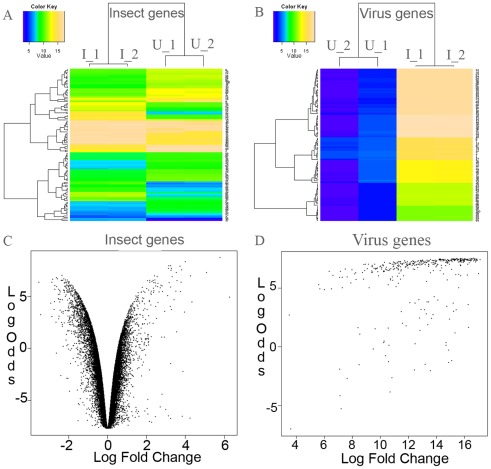
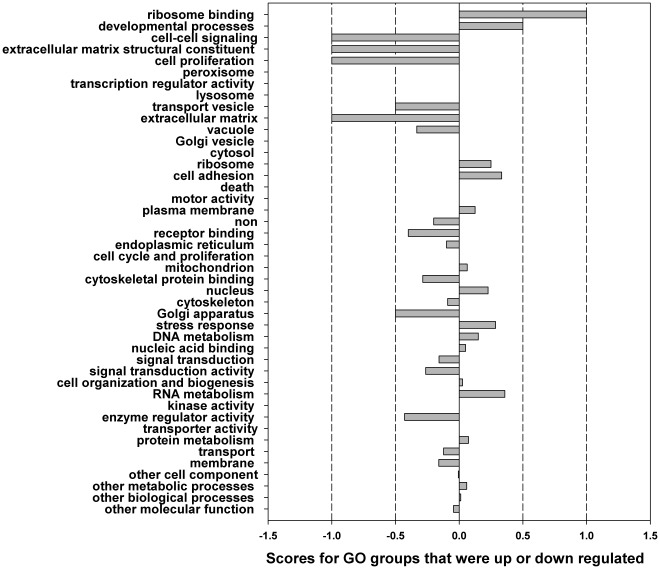
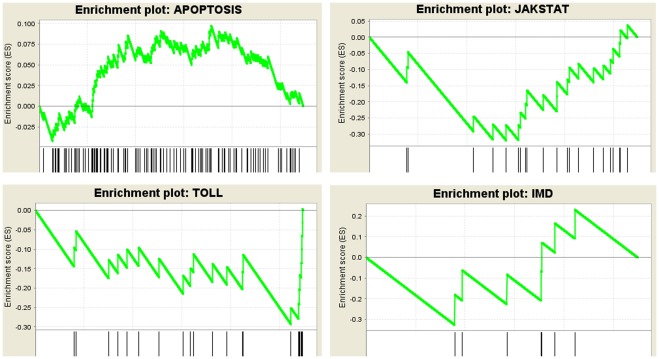
The Heliothine insect complex contains some of the most destructive pests of agricultural crops worldwide, including the closely related Helicoverpa zea and H. armigera. Biological control using baculoviruses is practiced at a moderate level worldwide. In order to enable more wide spread use, a better understanding of cell-virus interactions is required. While many baculoviruses have been sequenced, none of the Heliothine insect genomes have been available. In this study, we sequenced, assembled and functionally annotated 29,586 transcripts from cultured H. zea cells using Illumina 100 bps and paired-end transcriptome sequencing (RNA-seq). The transcript sequences had high assembly coverage (64.5 times). 23,401 sequences had putative protein functions, and over 13,000 sequences had high similarities to available sequences in other insect species. The sequence database was estimated to cover at least 85% of all H. zea genes. The sequences were used to construct a microarray, which was evaluated on the infection of H. zea cells with H. Armigera single-capsid nucleopolyhedrovirus (HearNPV). The analysis revealed that up-regulation of apoptosis genes is the main cellular response in the early infection phase (18 hours post infection), while genes linked to four major immunological signalling pathways (Toll, IMD, Jak-STAT and JNK) were down-regulated. Only small changes (generally downwards) were observed for central carbon metabolism. The transcriptome and microarray platform developed in this study represent a greatly expanded resource base for H. zea insect-HearNPV interaction studies, in which key cellular pathways such as those for metabolism, immune response, transcription and replication have been identified. This resource will be used to develop better cell culture-based virus production processes, and more generally to investigate the molecular basis of host range and susceptibility, virus infectivity and virulence, and the ecology and evolution of baculoviruses.
Conflict of interest statement
Figures
Similar articles
-
Genome scale analysis of differential mRNA expression of Helicoverpa zea insect cells infected with a H. armigera baculovirus.Virology. 2013 Sep;444(1-2):158-70. doi: 10.1016/j.virol.2013.06.004. Epub 2013 Jul 1. Virology. 2013. PMID: 23827436
-
A Renewed Appreciation of Helicoverpa armigera Nucleopolyhedrovirus BJ (Formerly Helicoverpa assulta Nucleopolyhedrovirus) with Whole Genome Sequencing.Viruses. 2022 Mar 16;14(3):618. doi: 10.3390/v14030618. Viruses. 2022. PMID: 35337025 Free PMC article.
-
Dynamics of the Interaction between Cotton Bollworm Helicoverpa armigera and Nucleopolyhedrovirus as Revealed by Integrated Transcriptomic and Proteomic Analyses.Mol Cell Proteomics. 2017 Jun;16(6):1009-1028. doi: 10.1074/mcp.M116.062547. Epub 2017 Apr 12. Mol Cell Proteomics. 2017. PMID: 28404795 Free PMC article.
-
Baculovirus induced transcripts in hemocytes from the larvae of Heliothis virescens.Viruses. 2011 Nov;3(11):2047-64. doi: 10.3390/v3112047. Epub 2011 Oct 28. Viruses. 2011. PMID: 22163334 Free PMC article. Review.
-
Understanding heliothine (Lepidoptera: Heliothinae) pests: what is a host plant?J Econ Entomol. 2014 Jun;107(3):881-96. doi: 10.1603/ec14036. J Econ Entomol. 2014. PMID: 25026644 Review.
Cited by
-
Toward system-level understanding of baculovirus-host cell interactions: from molecular fundamental studies to large-scale proteomics approaches.Front Microbiol. 2012 Nov 9;3:391. doi: 10.3389/fmicb.2012.00391. eCollection 2012. Front Microbiol. 2012. PMID: 23162544 Free PMC article.
-
Gut Transcription in Helicoverpa zea is Dynamically Altered in Response to Baculovirus Infection.Insects. 2013 Sep 23;4(3):506-20. doi: 10.3390/insects4030506. Insects. 2013. PMID: 26462433 Free PMC article.
-
Increase in gut microbiota after immune suppression in baculovirus-infected larvae.PLoS Pathog. 2013;9(5):e1003379. doi: 10.1371/journal.ppat.1003379. Epub 2013 May 23. PLoS Pathog. 2013. PMID: 23717206 Free PMC article.
-
Novel partiti-like viruses are conditional mutualistic symbionts in their normal lepidopteran host, African armyworm, but parasitic in a novel host, Fall armyworm.PLoS Pathog. 2020 Jun 22;16(6):e1008467. doi: 10.1371/journal.ppat.1008467. eCollection 2020 Jun. PLoS Pathog. 2020. PMID: 32569314 Free PMC article.
-
Evaluation of Reference Genes for Normalization of RT-qPCR Gene Expression Data for Trichoplusia ni Cells During Antheraea pernyi (Lepidoptera: Saturniidae) Multicapsid Nucleopolyhedrovirus (AnpeNPV) Infection.J Insect Sci. 2019 Jan 1;19(1):4. doi: 10.1093/jisesa/iey133. J Insect Sci. 2019. PMID: 30624703 Free PMC article.
References
-
- Jacobson A, Foster R, Krupke C, Hutchison W, Pittendrigh B, et al. Resistance to Pyrethroid Insecticides in Helicoverpa zea (Lepidoptera: Noctuidae) in Indiana and Illinois. J Econ Entomol. 2009;102:2289–2295. - PubMed
-
- Szewczyk B, Rabalski L, Krol E, Sihler W, de Souza ML. Baculovirus biopesticides - a safe alternative to chemical protection of plants. Journal of Biopesticides. 2009;2:209–216.
-
- Moscardi F, Souza ML, Castro MEB, Moscardi M, Szewczyk B. Baculovirus Pesticides: Present State and Future Perspectives. In: Ahmad I, Ahmad F, Pichtel J, editors. Microbes and Microbial Technology. 1st ed. New York: Springer; 2011. pp. 415–445.
-
- Mena JA, Kamen AA. Insect cell technology is a versatile and robust vaccine manufacturing platform. Expert Rev Vaccines. 2011;10:1063–1081. - PubMed
Publication types
MeSH terms
LinkOut - more resources
Full Text Sources
Other Literature Sources
Molecular Biology Databases
Research Materials
